Articles
- Page Path
- HOME > J Korean Powder Metall Inst > Volume 27(1); 2020 > Article
-
ARTICLE
- Fabrication of FeCuNi alloy by mechanical alloying followed by consolidation using high-pressure torsion
- Peyman Asghari-Rada,b, Yongju Kima, Nhung Thi-Cam Nguyena,b, Hyoung Seop Kima,b,c,*
-
Journal of Korean Powder Metallurgy Institute 2020;27(1):1-7.
DOI: https://doi.org/10.4150/KPMI.2020.27.1.1
Published online: January 31, 2020
a Department of Materials Science and Engineering, Pohang University of Science and Technology (POSTECH), Pohang 37673, Republic of Korea
b Center for High Entropy Alloys, Pohang University of Science and Technology (POSTECH), Pohang 37673, Republic of Korea
c Graduate Institute of Ferrous Technology (GIFT), Pohang University of Science and Technology (POSTECH), Pohang 37673, Republic of Korea
- *Corresponding Author: Hyoung Seop Kim, TEL: +82-54-279-2150, FAX: +82-54-279-2399, E-mail: hskim@postech.ac.kr
- - P. Asghari-Rad · Yongju Kim · N. Thi-Cam Nguyen: 학생, Hyoung Seop Kim: 교수
• Received: February 5, 2020 • Accepted: February 20, 2020
© The Korean Powder Metallurgy Institute. All rights reserved.
- 1,103 Views
- 4 Download
- 1 Crossref
Abstract
- In this research, a new medium-entropy alloy with an equiatomic composition of FeCuNi was designed using a phase diagram (CALPHAD) technique. The FeCuNi MEA was produced from pure iron, copper, and nickel powders through mechanical alloying. The alloy powders were consolidated via a high-pressure torsion process to obtain a rigid bulk specimen. Subsequently, annealing treatment at different conditions was conducted on the four turn HPT-processed specimen. The microstructural analysis indicates that an ultrafine-grained microstructure is achieved after post-HPT annealing, and microstructural evolutions at various stages of processing were consistent with the thermodynamic calculations. The results indicate that the post-HPT-annealed microstructure consists of a dual-phase structure with two FCC phases: one rich in Cu and the other rich in Fe and Ni. The kernel average misorientation value decreases with the increase in the annealing time and temperature, indicating the recovery of HPT-induced dislocations.
- Compositionally complex alloys (CCAs) as a new generation of metallic materials have been attracted worldwide attention in engineering society. Based on the configurational entropy, the CCAs are categorized into medium-entropy alloys (MEAs) and high-entropy alloys (HEAs) [1-3]. The CCAs possess superior physical and mechanical properties over conventional alloys [4-6]. There have been many attempts to develop new CCAs for practical applications leading to emerging various classes of these alloys [7-9].
- Mechanical alloying (MA) as a powder metallurgy route was one of the techniques commonly used to fabricate new CCAs [10]. In the MA process, a high-energy impact through milling of pure element powders and media accelerates the atomic diffusion among the powders resulting in making alloy [11]. After fabrication of the alloy, the consolidation of powders is needed to make a bulk sample. High-pressure torsion (HPT) which is known as a severe plastic deformation (SPD) technique can also be used to consolidate metallic powders [12]. The HPT processing of powders has been conducted on pure elements and several conventional alloys which led to making a bulk sample with nanocrystalline microstructure and ultra-high densification [12, 13].
- The HPT processing is mainly used to produce nanocrystalline metallic materials leading to improve the yield strength [6, 14, 15]. However, it is a common behavior in HPT processed specimens that the yield strength increases in the cost of a drastic decrease in elongation-to-failure [16]. An effective approach to fine-tune the tensile properties is post-HPT annealing that has been successfully applied in CCAs and conventional alloys [17-19]. The improvement of elongation after post-HPT annealing has been suggested to be attributed to the dislocation recovery [20].
- In the present study, FeCuNi MEA with an equiatomic composition was newly designed utilizing thermodynamic calculations. This alloy was fabricated through MA processing and consolidated by HPT. Consequently, the microstructural evolution during the post-HPT treatment was investigated.
1. Introduction
- The CALPHAD approach utilizing Thermo-Calc software with a database of upgraded TCFE2000 version was used to design FeCuNi MEA [21]. The powders of Ni, Fe, and Cu elements with a purity of >99.9% were mechanically alloyed in a planetary milling machine. The milling process was carried out with a rotation rate of 600 rpm, the ball to powder weight ratio of 10:1 (stainless steel balls), in the acetone for different milling times of 12, 24, 36, and 48 h. The milling was performed in cycles consisting of milling for 2 h followed by a 30 min pause for cooling down. The powder milled for 48 h was used for consolidation study. A cold pressing process was carried out at ~20 MPa to compress the as-milled powder into the disk-shaped specimen with a diameter of ~10 mm and a thickness of ~2 mm. Then, the pre-compacted specimen was subjected to the HPT process for 4 rotations under a pressure of 5 GPa, and a rotation rate of 1 rpm. The annealing was performed on the HPT processed specimen at temperatures of 800 and 900 °C, and holding times of 15 and 60 minutes.
- The specimens were prepared for microstructural analysis via mechanical polishing using SiC papers up to 1200 grit, diamond (3 μm and 1 μm paste), and colloidal silica, respectively. X-ray diffraction (XRD) analysis was conducted on the specimens at different stages of the procedure for phase characterization. The XRD scans were performed using Rigaku D/MAX-2500 equipment with the incident beam of Cu Kα radiation (wavelength = 1.5418 Å) in the 2θ range of 30–100°, a step size of 0.02°, and a scan speed of 1°/min. A scanning electron microscope (SEM) was implied to analyze the morphology of particles. In order to evaluate the microstructural evolution during the post-HPT annealing, electron backscatter diffraction (EBSD) analysis was carried out utilizing a field emission- SEM (FE-SEM; Quanta 3D FEG, FEI Company, USA). The TSL OIM analysis 7 software was used to interpret the EBSD data. Electron-dispersive spectroscopy (EDS) analysis was conducted using an FESEM (Model: JSM-7800F PRIME, JEOL Ltd., Japan).
2. Experimental methods and procedure
- 3.1. Thermodynamic calculations
- In the present FeCuNi MEA, the equilibrium fraction of different phases was determined utilizing thermodynamic calculations [22]. Figure 1 presents the fraction of equilibrium phases at the temperature range from 0 to 1500 °C. The FeCuNi MEA consists of three phases from 0 to ~403 °C including one body-centered cubic (BCC) and two face-centered cubic (FCC) phases. As temperature increases above 403 °C, the BCC phase removes from the structure and two FCC phases become stable. One of the FCC structures is rich in Fe and Ni elements and the other one is rich in Cu element. By a further increase in temperature, a single-phase region is stable from ~1071 to ~1239 °C.
- 3.2. Mechanical alloying process
- Figure 2 shows the SEM micrographs of the pure Fe, Cu, and Ni particles used for mechanical alloying in the present study. The Fe and Cu particles have irregular morphology with large particle sizes. While the Ni particles are very fine as compared to the Fe and Cu particles.
- The SEM micrographs of powders at different milling times are illustrated in Fig. 3. As it is apparent, the powder particles are flattened and changed into the flaky morphology through the collision of stainless steel balls during the milling process. Also, the size of flaky-shaped powders decreases by an increase in the milling time due to further fragmentation. The flaky morphology was previously observed in conventional alloys during the mill- ing [23, 24].
- The X-ray diffraction pattern of the powder milled for 48 h is illustrated in Fig. 4. Close inspection of the XRD pattern indicates that the milled powder consists of three phases: two FCC phases with different lattice parameters and one BCC phase. This result well complies with the equilibrium phase diagram represented in Fig. 1.
- 3.3. Consolidation of powders using HPT
- Figure 5a shows images of FeCuNi specimens at different stages of the consolidation process. First, the milled FeCuNi powder is compressed using the handpress machine and a disk-shaped specimen is obtained. Then, high pressure of 5 GPa is applied using HPT equipment. Subsequently, rotation is performed for 4 turns and a highly condensed specimen is achieved. The polished HPT processed specimen shows a mirror-like surface without any macro-cracks. The optical micrograph of the 4 turns HPT processed specimen is shown in Fig. 5b and 5c at different magnifications. It is clear that a rigid bulk structure without any cracks is achieved after 4 turns of HPT processing. At higher magnification, some black regions are observed which can be attributed to the micro-voids or oxide particles.
- 3.4. Post-HPT annealing
- Figure 6 illustrates the SEM micrograph and EDS maps of the specimen which is post-HPT annealed at 900 °C for 60 min. In the SEM image, an ultrafine-grained matrix with several micro-voids is apparent when the voids are depicted by yellow arrows. Also, some small black dots are visible which might be related to the contamination or pitting during the polishing by colloidal silica. The EDS maps show that the microstructure consists of two regions; (1) Rich in Cu and poor in Fe and Ni, and (2) Rich in Fe and Ni, and poor in Cu. These results are in good agreement with the thermodynamic calculations which is illustrated in Fig. 1. According to the equilibrium phase diagram, there are two FCC phases with different chemical compositions stable at 900 °C.
- The EBSD inverse pole figure (IPF) and kernel average misorientation (KAM) maps of consolidated FeCuNi MEA specimens after post-HPT annealing at temperatures of 800 and 900 °C for holding times of 15 and 60 min are presented in Fig. 7. In the IPF images, the high angle boundaries are delineated by black color and annealing twins (Σ3) are depicted by red colors. The EBSD image of the specimen annealed at 800 °C for 15 min displays an ultrafine-grained microstructure with an average grain size of ~240 nm (Fig. 7a). By increasing the annealing time to 60 min at 800 °C, the grain growth occurs and the average grain size reaches ~259 nm (Fig. 7b). An increase in annealing temperature to 900 °C results in an increment of grain size to ~305 nm and ~620 nm at holding times of 15 and 60 min, respectively (Fig. 7c and 7d).
- The KAM map is basically related to the dislocation density of material showing the strain distribution in the microstructure by measuring the evolution in the local orientation. The KAM maps illustrated in Fig. 7 were calculated up to the 3rd nearest neighbor with a maximum misorientation of five degrees. According to the KAM maps, it is apparent that the grain interior region presents lower KAM value as compared to the region near the grain boundaries. Moreover, the average KAM values of post-HPT annealed specimens at different annealing conditions are mentioned in Fig. 7. The average KAM value of the specimen annealed at 800 °C for 15 min presents a high value of ~1.10°. The high average KAM value indicates that the specimen contains a high dislocation density which was formed during the HPT processing [20]. The results point out that the average KAM value decreases by an increase in annealing time and temperature. The decline in KAM value during the post-HPT annealing implies the recovery of HPTinduced dislocations [17, 20].
- In addition, it is important to mention that all the specimens which are annealed at 800 and 900 °C consist of dual FCC-phase structure, however the EBSD technique is unable to distinguish them due to their similar crystalline structure.
3. Results and Discussion
Fig. 3
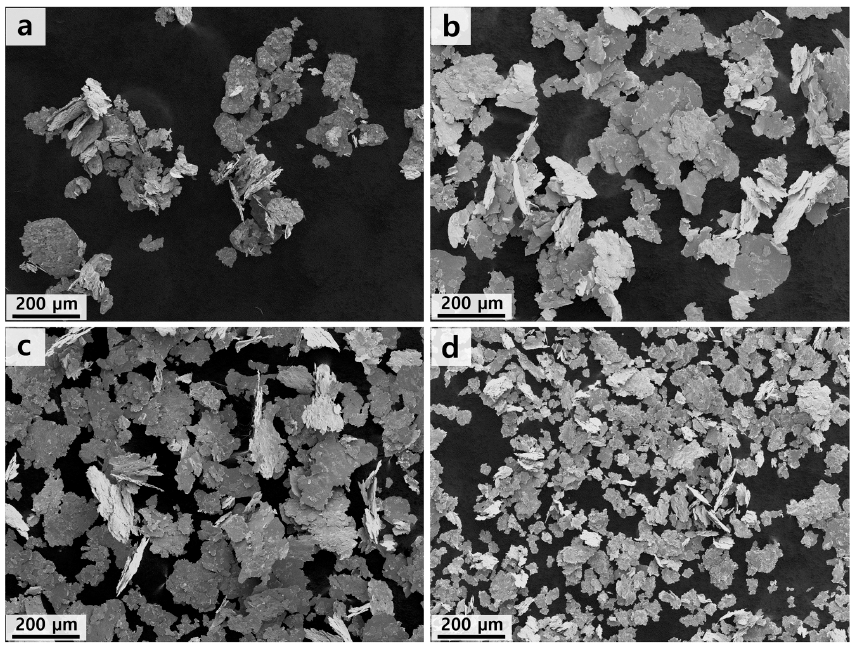
SEM micrographs of milled FeCuNi MEA particles at different milling times. (a) 12 h, (b) 24 h, (c) 36 h, and (d) 48 h.

Fig. 5
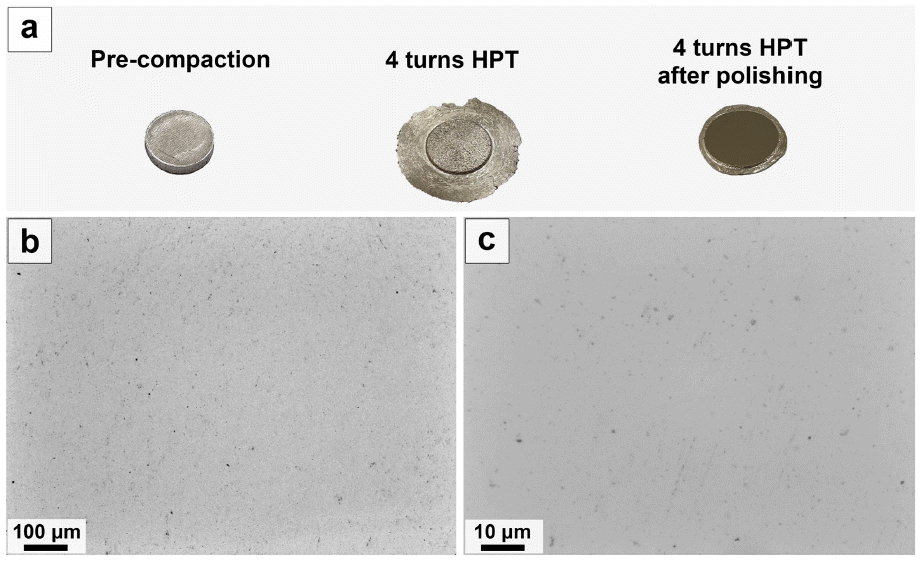
(a) Images of FeCuNi MEA specimens at different processing conditions. (b, c) Optical micrographs of 4 turns HPT processed specimen at different magnification of 100X and 1000X, respectively.

Fig. 6
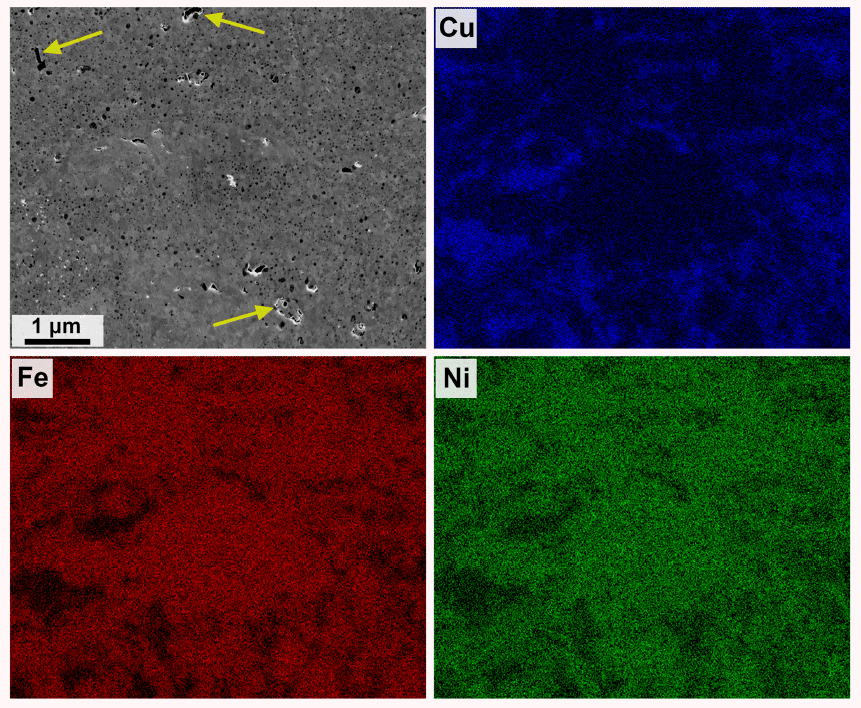
SEM micrograph and corresponding EDS mapping of constituent elements after post-HPT annealing at 900 °C for 60 min.

Fig. 7
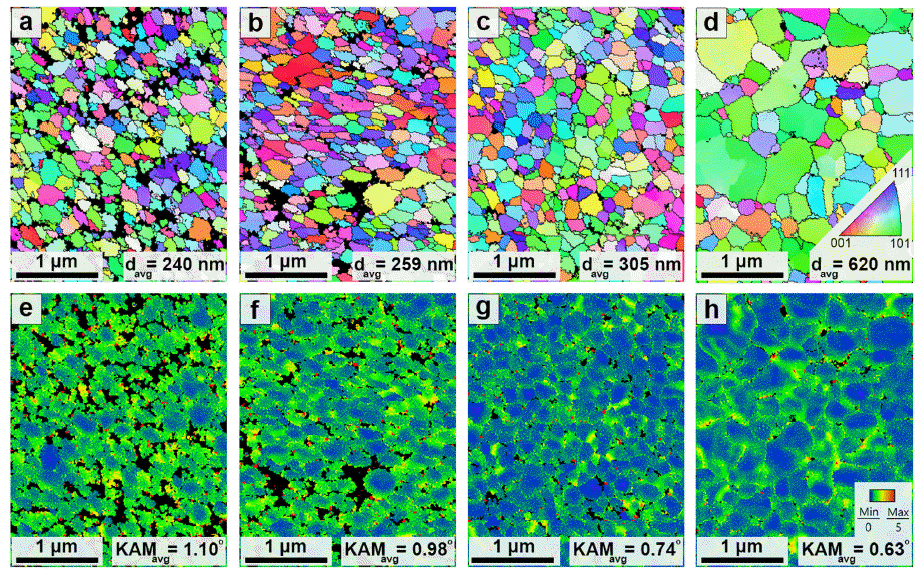
EBSD-IPF and corresponding KAM maps of post-HPT annealed FeCuNi specimens after annealing at (a, e) 800 °C for 15 min, (b, f) 800 °C for 60 min, (c, g) 900 °C for 15 min, and (d, h) 900 °C for 60 min.

- In the current study, the FeCuNi MEA was designed using a thermodynamic calculation approach and successfully fabricated by mechanical alloying. Consequently, the alloy powder was consolidated through HPT processing and a rigid bulk specimen with very high densification was obtained. The microstructural analysis after post- HPT annealing demonstrated a dual-phase structure with two FCC phases: one rich in Cu element and the other phase rich in Fe and Ni elements. The experimental results showed a good agreement with the thermodynamic calculation. The specimen annealed at the lower temperature and shorter time presented a high KAM value indicating the presence of a high dislocation density. While the specimens annealed at the higher temperature and prolonged time exhibited lower KAM value indicating the recovery of HPT-induced dislocations.
4. Conclusion
-
Acknowledgements
- This research was financially supported by the National Research Foundation of Korea (NRF: 2016M3D1A 102338), and Ministry of Trade, Industry and energy (20000495). We would like to appreciate Prof. Byeong- Joo Lee from POSTECH for helping us with Thermodynamic calculations.
Acknowledgments
- 1. A. Shafiee, M. Nili-Ahmadabadi, H. S. Kim and M. Jahazi: Met. Mater. Int., (2019). .
- 2. A. Poulia, E. Georgatis and A. Karantzalis: Met. Mater. Int., 25 (2019) 1529. .Article
- 3. X. Chen, D. Gao, J. X. Hu, Y. Liu and C. P. Tang: Met. Mater. Int., 25 (2019) 1135. .Article
- 4. P. Asghari-Rad, P. Sathiyamoorthi, J. W. Bae, J. Moon, J. M. Park, A. Zargaran and H. S. Kim: Mater. Sci. Eng. A, 744 (2018) 610. .Article
- 5. N. T. C. Nguyen, J. Moon, P. Sathiyamoorthi, P. Asghari- Rad, G. H. Kim, C. S. Lee and H. S. Kim: Mater. Sci. Eng. A, 764 (2019) 138198. .Article
- 6. P. Asghari-Rad, P. Sathiyamoorthi, J. W. Bae, H. Shahmir, A. Zargaran and H. S. Kim: Adv. Eng. Mater., 22 (2020) 1900587. .Article
- 7. P. Sathiyamoorthi, P. Asghari-Rad, J. M. Park, J. Moon, J. W. Bae, A. Zargaran and H. S. Kim: Mater. Sci. Eng. A, 766 (2019) 138372. .Article
- 8. M. J. Jang, H. Kwak, Y. W. Lee, Y. Jeong, J. Choi, Y. H. Jo, W. M. Choi, H. J. Sung, E. Y. Yoon, S. Praveen, S. Lee, B. J. Lee, M. I. A. El Aal and H. S. Kim: Met. Mater. Int., 25 (2019) 277. .Article
- 9. P. Sathiyamoorthi, J. M. Park, J. Moon, J. W. Bae, P. Asghari-Rad, A. Zargaran and H. S. Kim: Materialia, 8 (2019) 100442. .Article
- 10. Ł. Rogal, Z. Szklarz, P. Bobrowski, D. Kalita, G. Garzeł, A. Tarasek, M. Kot and M. Szlezynger: Met. Mater. Int., 25 (2019) 930. .Article
- 11. M. S. El-Eskandarany: William Andrew Publ., Norwich, NY, USA (2001). .
- 12. M. M. Castro, P. H. R. Pereira, A. Isaac, T. G. Langdon and R. B. Figueiredo: Adv. Eng. Mater., (2019). .
- 13. I. V. Alexandrov, R. K. Islamgaliev, R. Z. Valiev, Y. T. Zhu and T. C. Lowe: Metall. Mater. Trans. A, 29 (1998) 2253. .Article
- 14. S. Praveen, J. W. Bae, P. Asghari-Rad, J. M. Park and H. S. Kim: Mater. Sci. Eng. A, 735 (2018) 394. .Article
- 15. P. Sathiyamoorthi, J. Moon, J. W. Bae, P. Asghari-Rad and H. S. Kim: Scr. Mater., 163 (2019) 152. .Article
- 16. S. Praveen, J. W. Bae, P. Asghari-Rad, J. M. Park and H. S. Kim: Mater. Sci. Eng. A, 734 (2018) 338. .Article
- 17. P. Asghari-Rad, P. Sathiyamoorthi, N. T. C. Nguyen, J. W. Bae, H. Shahmir and H. S. Kim: Mater. Sci. Eng. A, 771 (2020) 138604. .Article
- 18. P. Sathiyamoorthi, P. Asghari-Rad, J. W. Bae and H. S. Kim: Intermetallics, 113 (2019) 106578. .Article
- 19. P. Asghari-Rad, M. Nili-Ahmadabadi, H. Shirazi, S. Hossein Nedjad and S. Koldorf: Adv. Eng. Mater., 19 (2017) 1600663. .Article
- 20. P. Sathiyamoorthi, J. W. Bae, P. Asghari-Rad, J. M. Park, J. G. Kim and H. S. Kim: Entropy, 20 (2018) 849. .Article
- 21. K. G. Chin, H. J. Lee, J. H. Kwak, J. Y. Kang and B. J. Lee: J. Alloys Compd., 505 (2010) 217. .Article
- 22. W. M. Choi, S. Jung, Y. H. Jo, S. Lee and B. J. Lee: Met. Mater. Int., 23 (2017) 839. .Article
- 23. T. Raghu, R. Sundaresan, P. Ramakrishnan and T. R. R. Mohan: Mater. Sci. Eng. A, 304-306 (2001) 438. .Article
- 24. S. B. Li, J. X. Xie and Z. Y. Zhao: Mater. Sci. Technol., 20 (2004) 1345. .Article
Figure & Data
References
Citations
Citations to this article as recorded by 

- Effects of nickel content and annealing temperature on the magnetic characteristics of nanostructured FeCu alloys
Abderrahmane Younes
Journal of Materials Science: Materials in Electronics.2024;[Epub] CrossRef
Fabrication of FeCuNi alloy by mechanical alloying followed by consolidation using high-pressure torsion
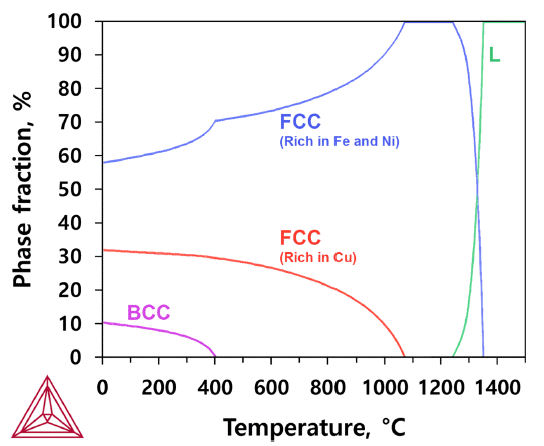


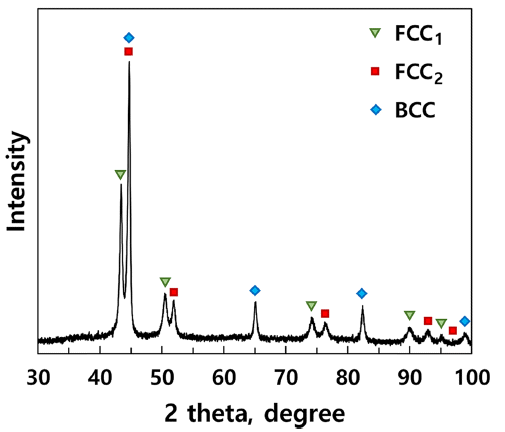


Fig. 1
Calculated equilibrium phase fraction vs. temperature for FeCuNi MEA.
Fig. 2
Scanning electron microscope (SEM) images of pure (a) Fe, (b) Cu, and (c) Ni particles.
Fig. 3
SEM micrographs of milled FeCuNi MEA particles at different milling times. (a) 12 h, (b) 24 h, (c) 36 h, and (d) 48 h.
Fig. 4
X-ray diffraction pattern of the FeCuNi MEA powder milled for 48 h.
Fig. 5
(a) Images of FeCuNi MEA specimens at different processing conditions. (b, c) Optical micrographs of 4 turns HPT processed specimen at different magnification of 100X and 1000X, respectively.
Fig. 6
SEM micrograph and corresponding EDS mapping of constituent elements after post-HPT annealing at 900 °C for 60 min.
Fig. 7
EBSD-IPF and corresponding KAM maps of post-HPT annealed FeCuNi specimens after annealing at (a, e) 800 °C for 15 min, (b, f) 800 °C for 60 min, (c, g) 900 °C for 15 min, and (d, h) 900 °C for 60 min.
Fig. 1
Fig. 2
Fig. 3
Fig. 4
Fig. 5
Fig. 6
Fig. 7
Fabrication of FeCuNi alloy by mechanical alloying followed by consolidation using high-pressure torsion
TOP
 KPMI
KPMI


 Cite this Article


