Articles
- Page Path
- HOME > J Korean Powder Metall Inst > Volume 28(4); 2021 > Article
-
Article
Nb 첨가 철계 합금의 Prior austenite 결정립크기 측정 방법 - 고광규a,c, 배효주a,c, 정신우b, 성효경a,c, 김정기a,c, 설재복a,c,*
- Measurement Method of Prior Austenite Grain Size of Nb-added Fe-based Alloys
- Kwang Kyu Koa,c, Hyo Ju Baea,c, Sin Woo Jungb, Hyo Kyung Sunga,c, Jung Gi Kima,c, Jae Bok Seola,c,*
-
Journal of Korean Powder Metallurgy Institute 2021;28(4):317-324.
DOI: https://doi.org/10.4150/KPMI.2021.28.4.317
Published online: July 31, 2021
a 경상국립대학교 나노신소재융합공학과
b 경상국립대학교 나노신소재공학부 금속재료공학과
c 경상국립대학교 K-metal
a Department of Materials Engineering and Convergence Technology, Gyeongsang National University (GNU), Jinju 52828, Republic of Korea
b Materials Science & Engineerings, Dept. of Metallurgical and Materials Engineering, Gyeongsang National University (GNU), Jinju 52828, Republic of Korea
c Department of Materials Engineering and Convergence Technology, Center for K-metal, Gyeongsang National University (GNU), Jinju 52828, Republic of Korea
- *Corresponding Author: Jae Bok Seol, TEL: +82-55-772-9535, FAX: +82-52-772-9535, E-mail: jb.seol@gnu.ac.kr
- - 고광규·배효주·정신우: 학생, 성효경·김정기·설재복: 교수
© The Korean Powder Metallurgy Institute. All rights reserved.
- 829 Views
- 7 Download
- 1 Crossref
Abstract
- High-strength low-alloy (HSLA) steels show excellent toughness when trace amounts of transition elements are added. In steels, prior austenite grain size (PAGS), which is often determined by the number of added elements, is a critical factor in determining the mechanical properties of the material. In this study, we used two etching methods to measure and compare the PAGS of specimens with bainitic HSLA steels having different Nb contents These two methods were nital etching and picric acid etching. Both methods confirmed that the sample with high Nb content exhibited smaller PAGS than its low Nb counterpart because of Nb’s ability to hinder austenite recrystallization at high temperatures. Although both etching approaches are beneficial to PAGS estimation, the picric acid etching method has the advantage of enabling observation of the interface containing Nb precipitate. By contrast, the nital etching method has the advantage of a very short etching time (5 s) in determining the PAGS, with the picric acid etching method being considerably longer (5 h).
- 일반적으로 고강도 저합금강(High-Strength Low-Alloy steels, HSLA steels)은 Nb, Ti, V 등과 같은 미량의 천이 원소를 첨가함으로써 저온인성 및 용접성이 우수하며, 균 일하게 분산된 석출물들과 템퍼링된 마르텐사이트 또는 베이나이트 조직으로 인해 우수한 인성을 지닌다. 이러한 특성으로 인해 석유 및 가스관, 중형 고속도로 및 오프로 드 차량, 건설 및 농기계, 산업 장비 등에 사용된다[1-5]. HSLA 강을 강화하는 방법에는 결정립 미세화, 석출 강화, 고용 강화 등이 존재하는데, 결정립 미세화는 소재의 강도 를 향상시키는 유용한 방법으로 사용되고 있다.
- 철강 소재에서는 Prior Austenite Grain(이하 P AG)의 크 기 및 형태를 파악하는 것이 중요한데, 이는 물성에서 중 요한 의미를 가지기 때문이다. Hall-Petch 효과는 결정립의 크기가 감소할수록 강도는 증가한다고 알려져 있다[6, 7]. 기존 문헌을 통해서 결정립의 크기가 강도와 연관되는 것 을 확인할 수 있는데[7], 강도가 정점에 달하는 대략 20~30 nm까지 입자 크기가 감소함에 따라 강도가 계속적 으로 증가하기 때문에 결정립 크기 제어는 철강소재의 기 계적 특성에서 중요한 요소로 작용하고 있다. M. Okatasu [8], J. Komotori[9] 등에서 결정립의 크기가 작을수록 강 재의 피로특성에도 긍정적인 영향을 준다는 것에 대해서 연구된 바 있다. 또한 냉각속도 차이에 따른 결정립 크기 의 영향 또한 미세조직 및 기계적 특성을 향상시킨다는 연구 결과[10]를 통해 결정립 크기의 중요성을 확인할 수 있다.
- 결정립 미세화를 시키기 위해 가공열처리(Thermo- Mechanical Controlled Process, TMCP) 공정 및 천이원소 를 첨가하는데[4, 11, 12], 천이원소의 첨가는 Austenite grain size를 감소시키는 효과를 얻을 수 있지만, 같은 공 정 조건에서 Nb의 함량이 일정 수준을 초과할 경우 반대 로 상변태를 촉진시킬 수 있는 요소로 작용할 수 있기 때 문에 첨가원소의 함량 조절이 중요하다[12-16]. 기존 연구 에서는 재결정 및 결정립 크기의 중요성에 관한 많은 연 구가 있지만, 에칭 방법에 따른 결정립 크기 측정에 관한 연구는 미비한 상황이다.
- 본 연구에서는 첨가원소 Nb 첨가량을 각각 0.021 wt.%, 0.04 wt.%로 다르게 하였을 때 저탄소(0.06 wt.% C) 베이 나이트강(0.14 wt.% Si, 1.55 wt.% Mn, 0.12 wt.% Ti+Mo) 의 P AG의 변화를 확인하기 위해서, Nital 용액과 Picric acid 용액을 이용하여 PAG를 효율적으로 관찰하고자 하였 다[17, 18].
1. 서 론
- 본 연구에서는 표 1의 조성에 따른 Nb 첨가 베이나이트 강을 이용하여 실험을 진행하였다. Nb 함량을 변화시키고 다른 합금원소들의 함량은 유사하게 설정하여 같으며 Nb 의 함량만 0.021 wt.%, 0.04 wt.%로 다르게 첨가하였다. 0.021 wt.% Nb이 첨가된 시편을 ‘2Nb’, 0.04 wt.% Nb가 첨가된 시편을 ‘4Nb’ 으로 표기하였다. 합금 제조 이를 재 가열하여 1,150°C에서 2시간 유지한 후 56%의 압연율로 초기 압연을 진행했다. 이후에 각각 810°C, 860°C에서 43%의 압연율로 마무리 압연을 시행하였다. 압연과정을 마친 뒤 각 시편을 3.4°C/s, 4.1°C/s의 냉각속도로 614°C, 607°C까지 수랭한 뒤 상온까지 공랭을 진행하여 시편을 제조하였다.
- 미세조직 관찰을 위해 시편의 압연 방향과 두께 방향을 포함하는 단면을 Sand paper를 이용하여 #200에서 #4000 까지 Macro polishing을 하였고, 3 μm, 1 μm Diamond suspension을 이용하여 Micro polishing을 차례로 진행하였 다. X-ray 회절 분석기(X-ray Diffraction, XRD)를 이용하 여 X선 회절 시험을 수행하였다. 시험에는 Cu Kα를 이용 하였고, 시험편은 판재의 윗면을 기계적 연마하여 준비하 였다.
- 시편의 상분율 분석을 위해 Thermo-CalTM을 이용하여 400°C~1,400°C 안의 범위에서 계산하였으며[19], 비커스 (Vickers) 경도시험은 10 kg의 하중으로 시편마다 10회 수 행하였다. 인장시험은 인장시험기(Instron 5882, Instron)를 이용하여 수행하였으며, Crosshead 속도 2 mm/min의 조건 으로 상온에서 실시하였다. 또한, 에칭 전, 후의 상 및 결 정립 등의 미세조직 변화를 관찰하기 위해 후방산란전자 회절패턴 분석(Electron Back-Scatter Diffraction, EBSD, JEOL; JSM-7900F) 장비를 이용하여 분석을 진행하였다.
- PAG를 관찰하기 위해 용액을 이용한 에칭을 진행하였 다. Thackray 등이 사용한 Picric acid 용액(5% Picric acid 2 g + Distilled water 100 ml + 10% Dodecylbenzene sulfonic acid sodium 2 ml)과 5% Picric acid 용액, 10% FeCl3 수용 액, 10% Dodecylbenzene sulfonic acid sodium 수용액으로 두 종류의 Picric 용액을 사용하였다. Picric acid 용액을 이 용한 에칭과 비교하기 위하여 Nital 용액을 이용한 에칭을 진행하였으며 5% Nital 용액(Ethanol 95 ml + Nitric acid 5 ml)을 이용하였다[17, 18]. 미세조직 분석은 광학현미경 (Olympus BX53M)을 이용하여 관찰하였다. PAG를 측정 하기 위해 Linear intercept method와 P lanimetric method를 이용하였는데, 각 측정법은 0.25라는 오차범위를 가지고 있 으므로 두 방법을 모두 이용하여 P AG를 측정하였다[20].
2. 실험 방법
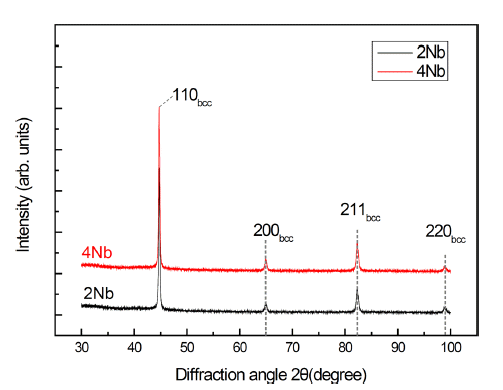
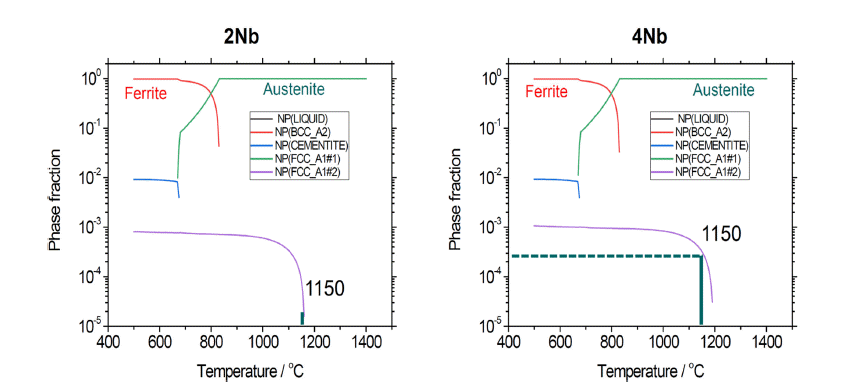
- 2Nb와 4Nb의 결정구조 파악을 위해 XRD 패턴 분석을 실시하였다. 그림 1은 2Nb, 4Nb의 XRD 패턴이다. 관측된 모든 회절 패턴을 통해서 2Nb와 4Nb은 BCC 구조인 것을 확인할 수 있었다. BCC 구조만 관측이 되는 이유는 이미 변태가 진행된 이후, 이차상으로 존재할 수 있는 P AG가 XRD로 측정할 수 없을 정도로 낮은 밀도를 가지고 있기 때문이다. 그림 2는 Thermo-CalTM을 이용하여 2Nb, 4Nb 의 Phase fraction 측정한 결과이다. 400°C~1,400°C 안의 범위에서 계산한 결과 1,150°C 기준에서 나노 사이즈의 FCC 석출물의 Phase fraction이 2Nb보다 4Nb이 높게 나 타나는 것을 확인할 수 있다. 이는 BCC peak만 측정된 XRD 결과와는 다르게 FCC가 관측되면서 PAG 관측을 위 해서는 XRD가 아닌 다른 방법을 통해 관찰해야 하는 것 을 보여준다.
- 그림 3은 비커스 경도시험과 인장시험 결과이다. Vickers microhardness는 2Nb에서는 평균 208.7 Hv, 4Nb에서 220.4 Hv로 측정되었다. 두 시편의 경도차이는 탄화물 생성원소 로 작용하는 Nb로 인해 오스테나이트와 페라이트의 결정 립 미세화가 발생하였으며, 열처리 중 석출물을 형성하여 기계적 성질이 향상되었기 때문이다. 이러한 탄화물은 고 온에서 안정하기 때문에 석출강화와 석출물에 의한 결정 립 성장 억제 및 Sub-grain 형성을 유발한다[4, 11, 12]. 항 복강도 또한 2Nb보다 4Nb에서 더 높게 측정되었으며, Hall-Petch 효과를 통해 4Nb의 결정립 크기가 2Nb보다 더 작을 것이라고 예측할 수 있다[7].
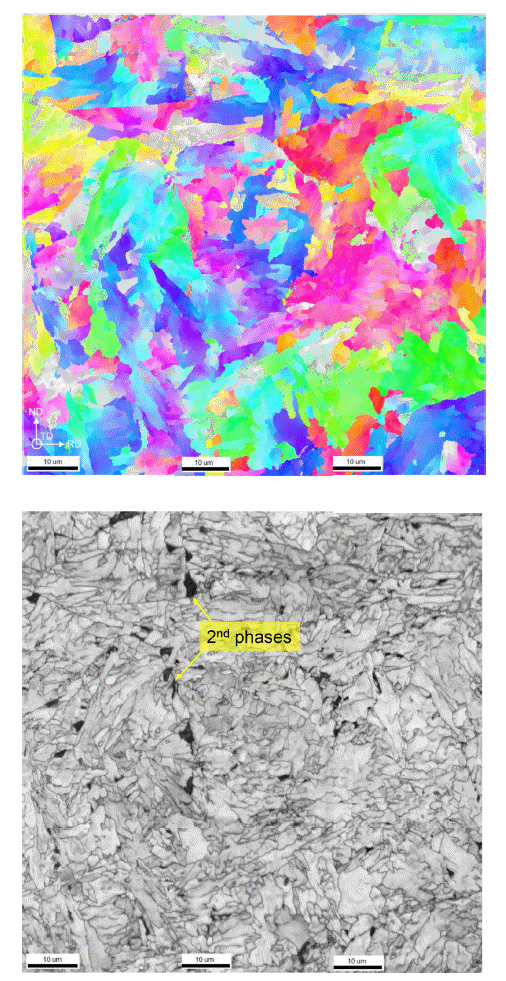
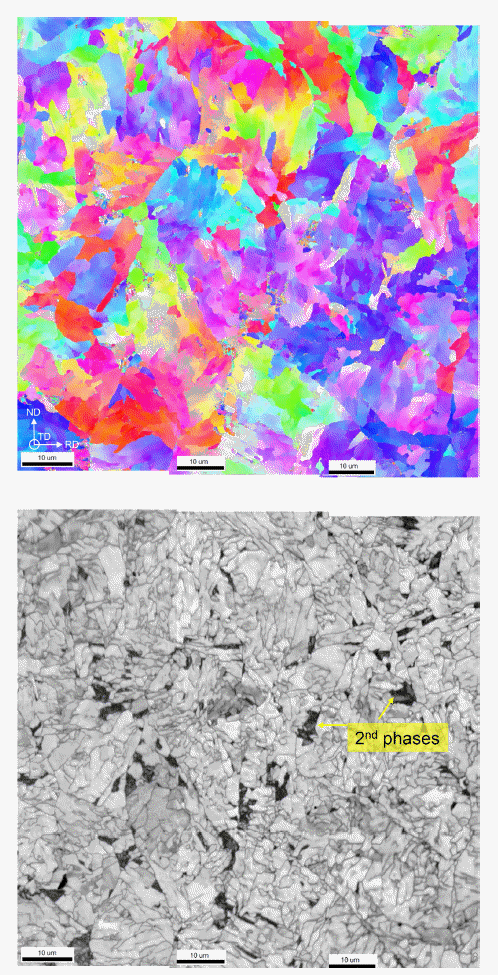
- 그림 4, 5의 EBSD 측정 결과 XRD 분석 결과와 마찬가 지로 Fully BCC로 나타났다. Quasi-polygonal ferrite, Granular bainitic ferrite와 이차상으로 이루어져 있으며, 이 차상인 Martensite or Austenite(이하 M/A)상은 Sub ferrite grain과 Grain boundary에 위치하였다. 그림 6에서 두 시 편의 EBSD data를 이용하여 Sub ferrite grain size를 측정 해보았다. 비교적 큰 차이가 나지 않는 것을 확인할 수 있 었으며, 이는 이미 Ferrite 변태가 완료되었기 때문에 본 연구에서 관찰하고자 하는 PAG 측정에는 어려움이 있었 다. Thermo-CalTM을 통한 Phase fraction 측정 및 EBSD data를 통해서는 P AG 관측이 어려웠기 때문에 에칭법을 이용하여 P AG 관측을 실시하였다[21, 22].
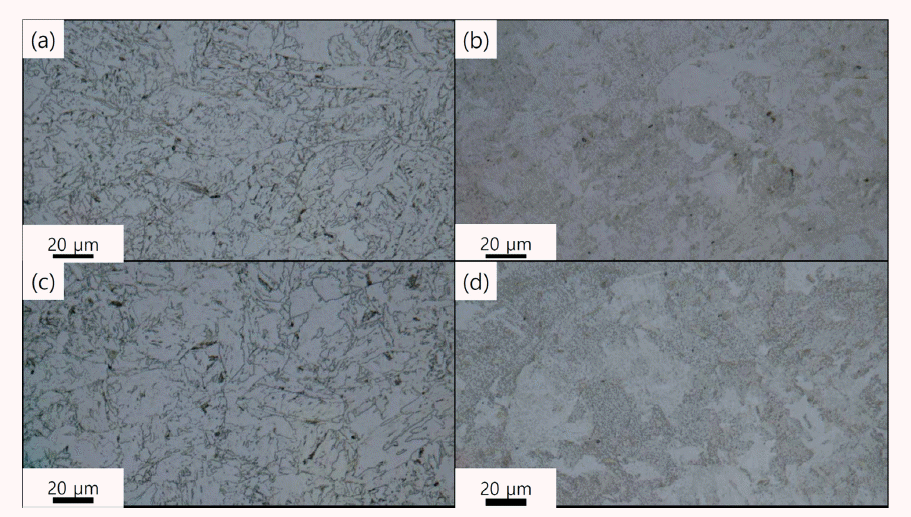
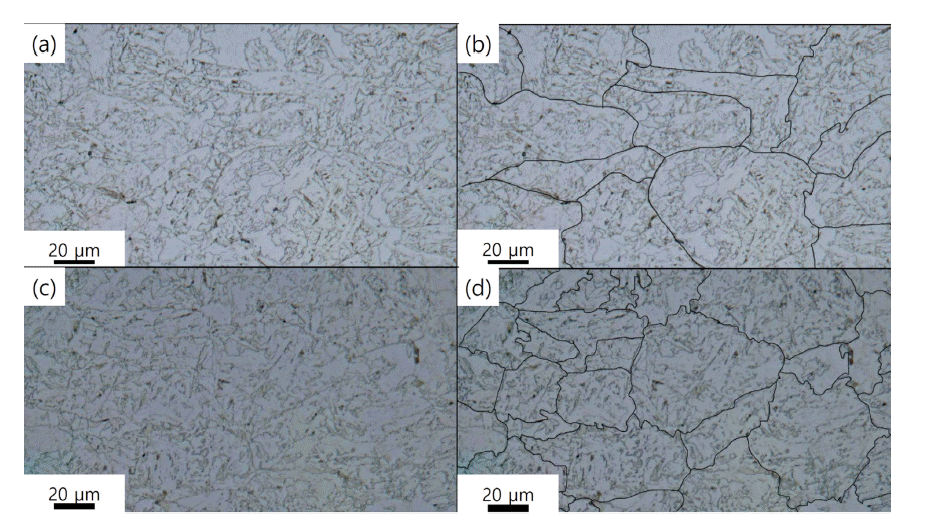
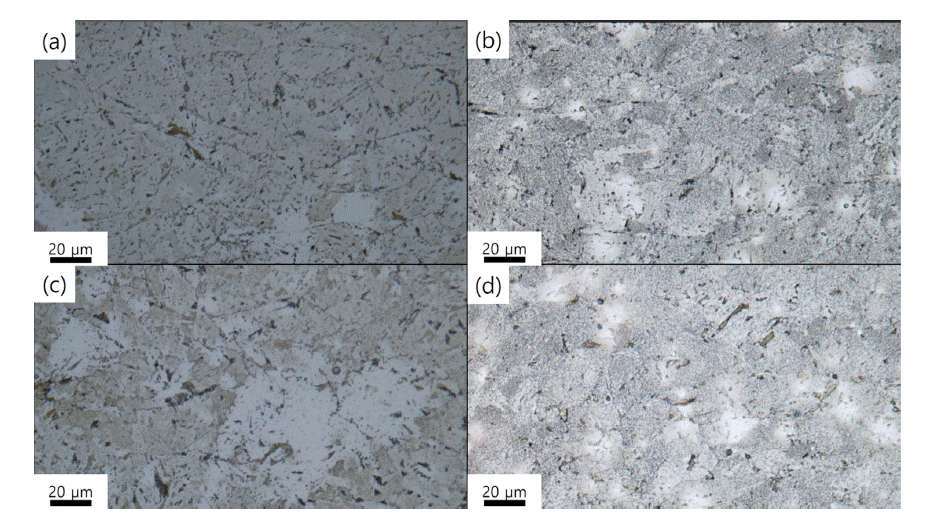
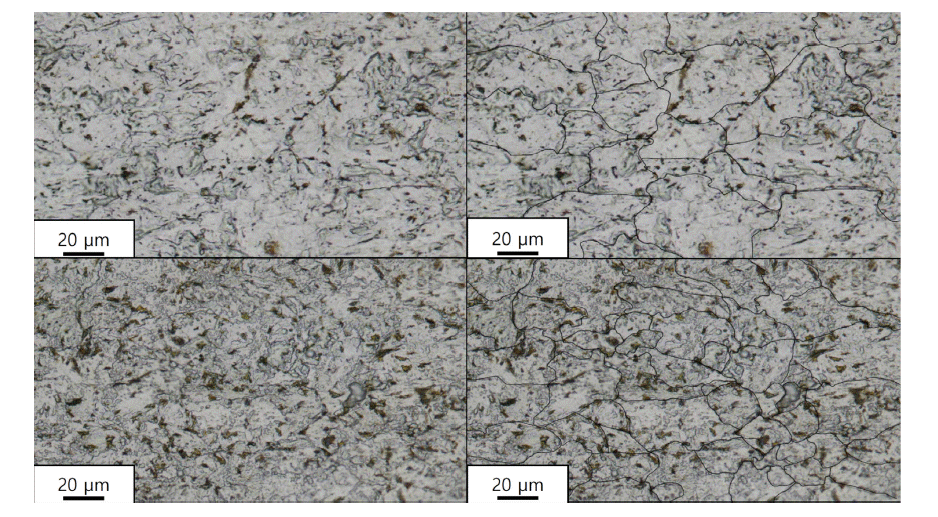
- 그림 7은 Nital 용액을 이용하여 에칭 시간에 따른 2Nb, 4Nb의 미세조직이다. 5초간 진행하였을 때는 비교적 뚜렷 한 결정립을 볼 수 있지만, 20초간 진행했을 때는 시편 대 부분이 탄 것을 확인할 수 있었다. 그림 8에서 두 시편을 5초간 Nital 용액을 이용하여 에칭하였다. Nital 에칭을 진 행하였을 때 광학현미경만을 이용하여 관찰하고자 하는 PAG를 명확하게 관찰하는 데 한계가 있었다. 그림 8-(a)는 2Nb의 미세조직 사진이다. 그림 8의 (a)에서 PAG size 측 정을 위해 결정립계를 (b)와 같이 표시하였으며, 4Nb 또 한 같은 방법으로 진행하였다.
- (a) Holding time 5 s of 2 Nb specimen, (b) Holding time 20 s of 2 Nb specimen, (c) Holding time 5 s of 4 Nb specimen, (d) Holding time 20 s of 4 Nb specimen.
- (a) Holding time 5 s of 2 Nb specimen, (b) Marked the PAG of 2 Nb specimen (5 s), (c) Holding time 5 s of 4 Nb specimen, (d) Marked the PAG of 4 Nb specimen (5 s).
- 그림 9은 Picric acid 에칭 시간에 따른 미세조직 사진이 다. FeCl3 수용액을 이용한 Picric acid 에칭(5% Picric acid 용액, 10% FeCl3 수용액, 10% Dodecylbenzene sulfonic acid sodium 수용액)은 계면 관찰을 위해 시간을 각기 다 르게 진행하였다[18]. 실험결과 시편의 표면만 손상되었고 계면이 뚜렷하게 관찰되지 않았으며, Nital 용액을 이용한 에칭에 비해 거의 에칭이 진행되지 않은 것을 관찰하였다. 이후 에칭 용액을 Thackray 등이 사용한 Picric acid 용액 (5% Picric acid 2 g + Distilled water 100 ml + 10% Dodecylbenzene sulfonic acid sodium 2 ml)으로 바꾸어 동일한 실 험을 진행하였다[17]. 그림 10은 2Nb, 4Nb을 Thackray 등 이 사용한 P icric acid 용액을 이용하여 5시간 에칭을 진행 한 미세조직이다. Picric aicd 용액을 이용한 에칭 또한 관 찰하고자 하는 P AG을 명확하게 관찰하는 것에는 한계가 있어 그림 8의 (b), (d)와 같이 결정립계를 표시하였다. 그 러나 Nital 용액을 이용한 에칭과는 다르게 Picric acid 용 액을 이용한 에칭의 경우 특정 부분 계면의 확인이 가능 하였다. Nital 용액을 통한 에칭에 비해서 Picric acid 용액 을 이용하여 진행한 에칭의 경우가 P AG 관찰에 있어서는 상대적으로 적합하였지만, 시간적인 측면에서 봤을 때는 Nital 용액을 이용한 에칭법이 우세하였다.
- (a) Holding time 5 s of 2 Nb specimen, (b) Holding time 20 s of 2 Nb specimen, (c) Holding time 5 s of 4 Nb specimen, (d) Holding time 20 s of 4 Nb specimen.
- Holding time 5 s of 2 Nb specimen, (b) Marked the PAG of 2 Nb specimen (5 s), (c) Holding time 5 s of 4 Nb specimen, (d) Marked the PAG of 4 Nb specimen (5 s).
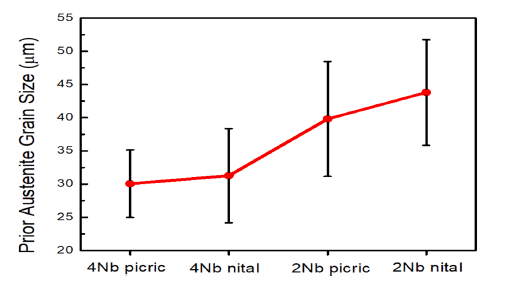
- 표 2는 2Nb, 4Nb의 에칭 방법에 따른 평균 P AG size를 Linear intercept 측정법을 이용하여 정리한 것이다[10]. 2 Nb의 경우 Nital 에칭의 경우엔 43.8 μm, Picric acid 에칭 의 경우엔 39.8 μm의 PAG s ize로 측정되었다. 4Nb의 경우 Nital 에칭은 31.25 μm, Picric acid 에칭은 30.05 μm의 PAG size가 측정되었다. 그림 11은 Linear intercept 측정 법 이용 시 측정 위치에 따라 Grain의 분포가 다르게 관 찰되기 때문에 표준편차와 함께 Grain size를 표시한 그래 프이다.
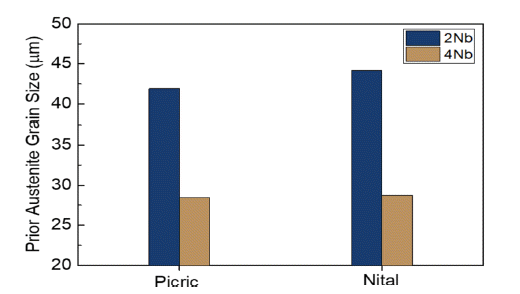
- 표 3, 그림 12은 Planimetric 측정법을 이용하여 평균 PAG size를 정리한 것이다. 2Nb의 경우 Nital 에칭은 44.21 μm, Picric acid 에칭은 41.94 μm, 4Nb의 경우 Nital 에칭은 28.74 μm, Picric acid 에칭은 28.44 μm로 측정되었 다. 두 측정법 모두 2Nb 보다 4Nb이 평균 P AG size가 더 작게 나오는 것을 확인하였다. 미세화의 원인으로는 Nb에 의해서 생성되는 탄질화물이 응고 시 결정립계에 불균일 핵 생성 사이트로 작용되어 재결정 효과를 증가시킨 것으 로 볼 수 있다[23]. 그 결과 PAG size는 Nb의 첨가량이 증 가할수록 더 많은 탄화물에 의해 감소하게 된다. 두 에칭 방법 모두 2Nb 및 4Nb의 PAG size는 각각 약 40 μm, 30 μm으로 측정되었다. 결정립 크기 감소에 따른 강도 향 상의 효과를 기대할 수 있으나, 석출물의 유무 및 분포에 따른 영향도 존재할 수 있기 때문에 추후 세부적인 연구 가 진행되어야 한다.
- Nital 용액 및 Picric acid 용액을 통한 에칭을 진행하였 을 때 미세조직에서의 차이가 나타나는 이유는 Nital 용액 을 이용한 에칭법과는 다르게 Picric acid 용액을 통한 에 칭법은 Matrix 내부의 Ferrite lamella 및 음극 Cementite를 느리지만 균일하게 융해시킨다. Ferrite lamella를 융해시 키지만 Ferrite grain boundaries는 융해시키지 않고 부식시 키기 때문에 조직 관찰에 용이하다. OM만으로 P AG 관찰 에는 다소 어려움이 존재하였지만, Nital 용액 에칭법과 다르게 Picric acid 용액을 통한 에칭법은 위의 효과들로 인해 Nb에 의해 형성된 탄질화물을 포함한 특정 계면을 관찰하는데 용이하였다. 그러나 본 연구에서 진행된 Nital 용액 에칭과 Picric acid 용액 에칭은 각각 시간적인 장점 과 조직 관찰의 장점을 가졌지만, 두 방법 모두에서 명확 한 P AG 관찰에는 어려움이 존재하였다. 에칭의 가장 큰 문제인 시간의 조절 및 용액의 농도 설정 등에 대한 연구 가 추가적으로 필요하며, 두 장점을 모두 지니는 에칭법에 대한 연구가 동시에 필요하다.
3. 결과 및 고찰
Typical granular bainite microstructure of 2Nb sample by EBSD scans in total. The microstructure was identified by Quasi-Polygonal Ferrite + Granular Bainitic Ferrite + 2nd phase. 2nd phase is pearlite and M/A.
Typical granular bainite microstructure of 4Nb sample by EBSD s cans i n total. T he m icrostru ctu re w as identified by Quasi-Polygonal Ferrite + Granular Bainitic Ferrite + 2nd phase. 2nd phase is pearlite and M/A.
Nital etching of 2Nb and 4 Nb specimens with different holding times.
Nb, 4Nb specimens etched with Nital etching method.
Picric acid etching of 2Nb and 4 Nb specimens with different holding times.
2 Nb, 4Nb specimens etched with Picric acid etching method.
Result of average PAG size measurement with specimen and each etching method by linear intercept method

|
Result of average PAG size measurement and standard deviation for specimen and etching method by Linear Intercept method.
Result of average PAG size measurement with specimen and each etching method by planimetric procedure

|
Result of average PAG size measurement with specimen and etching method by Planimetric procedure.
- 본 연구에서는 Nb 첨가량에 따른 P AG s ize를 관찰하기 위해 Nital 용액을 이용한 에칭과 Picric acid 용액을 이용 한 에칭을 진행하였으며, 그에 따른 효과에 대해서 다음과 같은 결론을 얻었다.
(1) 이미 변태가 진행된 이후의 두 시편에 존재할 수 있 는 PAG는 XRD로는 측정할 수 없을 정도의 낮을 밀 도를 보유하고 있기 때문에 XRD 분석이 아닌 다른 방법을 통해 분석을 실시하여야 한다.
(2) Nb 함량이 증가할수록 Vickers microhardness 및 항 복강도 등이 증가하는 것을 관찰할 수 있었다.
(3) Nb 함량이 증가할수록 Nital 용액을 이용한 에칭 및 Picric acid 용액을 이용한 에칭법 모두에서 높은 함 량의 Nb 시편의 PAG size가 작게 관찰되었으며 Hall-Petch 효과에 의하면 대략 16%정도의 강도 향 상효과를 관찰하였다.
(4) 본 연구에서 사용된 두 에칭법에 대해서 Nital 용액 사용시 짧은 시간을 사용하여 실험을 진행할 수 있 었지만, Picric acid 용액을 이용하였을 때 상대적으 로 더 명확한 PAG를 관찰할 수 있었다. 두 용액의 장점을 모두 포함할 수 있는 용액 및 에칭방법에 대 한 추가적인 연구가 이루어져야 한다.
4. 결 론
-
Acknowledgements
- 이 논문은 2021년도 정부(한국연구재단)의 재원으로 한 국연구재단의 지원을 받아 수행된 연구임(No.2021R1A2C 400262211).
감사의 글
- 1. J. R. Davis: Alloying: Understanding the Basics, ASM International, USA, (2001)..Article
- 2. M. S. Rashid: Science, 208 (1980) 862..ArticlePubMed
- 3. D. A. Skobir: Mater. Technol., 45 (2011) 295..
- 4. W. B. Lee, K. B. Kang and C. G. Park: Korean J. Met. Mater., 34 (1996) 688..
- 5. G. S. Park: Analysis of phase transformation theory in Nb alloyed HSLA steel by hot rolling deformation, M.S thesis. Hanyang Univ, Seoul, Republic of Korea (2016)..
- 6. M. Calcagnotto, D. Ponge, Y. Adachi and D. Raabe: In Proceedings of the 2nd International Symposium on Steel Science (ISSS 2009), Kyoto, Japan, (2009) 21..
- 7. N. Hansen: Scr. Mater., 51 (2004) 801..Article
- 8. M. Okatasu, K. Sato, M. Mizuno, D. Y. Hwang and D. H. Shin: Int. J. Fatigue, 30 (2008) 1358..Article
- 9. J. Komotori and M. Shimizu: ICF7 (1989) 1213..Article
- 10. G. H. Kim, J. H Jang, S. H. Kim, B. J. Kim, K. Y. Sohn and D. G. Nam: Korean J. Met. Mater., 55 (2017) 559..
- 11. G. R. Wang, T. W. Lau, G. C. Weatherly and T. H. North: Metall. Trans. A, 20 (1989) 2093..Article
- 12. M. Islam and M. M. A. Bepari: J. Mater. Eng. Perform., 5 (1996) 593..Article
- 13. C. B. Park: The effect of austenite grain size on the γ/α transformation in Nb added microalloyed steel, M.S thesis. Hanyang Univ, Seoul, Republic of Korea (2010).
- 14. B. Dutta, E. Valdes and C. M. Sellars: Acta Metall. Mater., 40 (1992) 653..Article
- 15. J. G. Speer and S. S. Hansen: Metall. Trans. A, 20 (1989) 25..Article
- 16. A. Matsuzaki and H. K. D. H. Bhadeshia: Mater. Sci. Technol., 15 (1999) 518..Article
- 17. R. Thackray, E. J. Palmiere and O. Khalid: Materials, 13 (2020) 3296..ArticlePubMedPMC
- 18. ASTM E407-07e1, Standard Practice for Microetching Metals and Alloys, ASTM International, West Conshohecken, PA (2007)..
- 19. J. O. Andersson, T. Helander, L. Hoglund, P. Shi and B. Sundman: Calphad, 26 (2002) 273..Article
- 20. ASTM E112-13, Standard Test Methods for Determining Average Grain Size, ASTM International, West Conshohocken, PA (2013)..
- 21. A. W. Brewer, K. A. Erven and G. Krauss: Mater. Charact., 27 (1991) 53..Article
- 22. V. L. Viswanathan: Metallography, 10 (1977) 291..Article
- 23. D. A. Porter and K. E. Easterling: Phase Transformation in Metals and Alloys(2nd Ed.) ITC, Korea (1992) 213..Article
Figure & Data
References
Citations

- Austempering vs. Q&P: Comparative effects on microstructure and mechanical properties of complex-alloyed TRIP-assisted steel
V.G. Efremenko, Yu.G. Chabak, I. Petryshynets, I. Sili, T.M. Kovbasiuk, A.V. Efremenko, M.N. Brykov, M. Dabalá, M. Franceschi, H. Halfa, A.G. Lekatou
Materials Today Communications.2025; 47: 113179. CrossRef


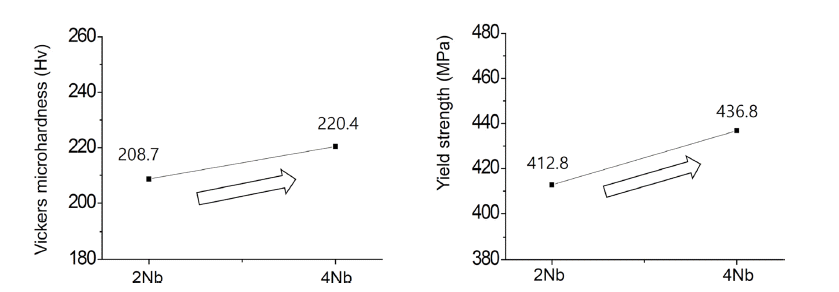


Fig. 1
Fig. 2
Fig. 3
Fig. 4
Fig. 5
Fig. 6
Fig. 7
Fig. 8
Fig. 9
Fig. 10
Fig. 11
Fig. 12
Table 1
Table 2
Table 3
TOP
 KPMI
KPMI




 ePub Link
 Cite this Article


