Warning: mkdir(): Permission denied in /home/virtual/lib/view_data.php on line 81

Warning: fopen(upload/ip_log/ip_log_2024-11.txt): failed to open stream: No such file or directory in /home/virtual/lib/view_data.php on line 83

Warning: fwrite() expects parameter 1 to be resource, boolean given in /home/virtual/lib/view_data.php on line 84
The Synthesis Method of Tin Dioxide Nanoparticles by Plasma-Assisted Electrolysis Process and Gas Sensing Property
Skip Navigation
Skip to contents

Journal of Powder Materials : Journal of Powder Materials

OPEN ACCESS
SEARCH
Search

Articles

Page Path
HOME > J Korean Powder Metall Inst > Volume 24(5); 2017 > Article
ARTICLE
The Synthesis Method of Tin Dioxide Nanoparticles by Plasma-Assisted Electrolysis Process and Gas Sensing Property
Tae Hyung Kim, Yoseb Songa, Chan-Gi Lee*, Yong-Ho Choaa,*
Journal of Korean Powder Metallurgy Institute 2017;24(5):351-356.
DOI: https://doi.org/10.4150/KPMI.2017.24.5.351
Published online: September 30, 2017

Advanced Materials & Processing Center, Institute for Advanced Engineering (IAE), Yongin 17180, Republic of Korea

a Department of Fusion Chemical Engineering, Hanyang University, Ansan 15588, Republic of Korea

*Corresponding Author: Yong-Ho Choa, +82-31-400-5650, +82-31-418-6490, choa15@hanyang.ac.kr
*Co Corresponding author : Chan Gi Lee, +82-31-330-7495, +82-31-330-7116, cglee@iae.re.kr
• Received: October 16, 2017   • Revised: October 21, 2017   • Accepted: October 23, 2017

© The Korean Powder Metallurgy Institute. All rights reserved.

  • 184 Views
  • 0 Download
  • 1 Crossref
next
  • Tin dioxide nanoparticles are prepared using a newly developed synthesis method of plasma-assisted electrolysis. A high voltage is applied to the tin metal plate to apply a high pressure and temperature to the synthesized oxide layer on the metal surface, producing nanoparticles in a low concentration of sulfuric acid. The particle size, morphology, and size distribution is controlled by the concentration of electrolytes and frequency of the power supply. The as-prepared powder of tin dioxide nanoparticles is used to fabricate a gas sensor to investigate the potential application. The particle-based gas sensor exhibits a short response and recovery time. There is sensitivity to the reduction gas for the gas flowing at rates of 50, 250, and 500 ppm of H2S gas.
Semiconducting oxide materials such as ZnO2, In2O3, WO3 and SnO2 had been investigated to be used as a gas sensor due to its sensitivity to reducing or oxidizing gases. Among these materials, n-type semiconducting material SnO2 has been intensively studied owing to its high chemical stability on gas sensing condition and electron mobility [1]. Thus, there had been many researches about gas sensing property of SnO2 with wide range of toxic gases such as ethanol and hydrogen sulfide [2-6]. Due to its characteristic of wide band gap 3.6 eV, it also can be used as transparent conducting oxides (TCOs) [7], optical electronic devise [8] and lithium batteries [9].
SnO2 gas sensors were usually prepared by way of thick and thin film on the substrate. Thin films are in great interest due to the efficient power consumption and high sensitivity. Nevertheless, it has poor mechanical property and low stability [10]. To enhance this disadvantage, thick films were prepared with the SnO2 nanoparticles.
The grain boundaries in the polycrystalline metal oxide nanoparticle can trap the charge between the adjacent grains which effected by the Schottky potential barrier [5, 11]. If the tin oxide nanoparticle is exposed to the air ambient, the oxygen adsorbed on the grain boundaries of the particle surface forms O2-, O- and O2- ions. As a result, it captures the free electrons from the oxygen vacancy, increasing the resistivity. When the reduction gas flows above the metal oxide such as carbon monoxide and ethanol, carbon dioxide and water vapor are produced due to the reaction between the oxygen ions and the reduction gas. It contributes to decrease the resistivity of a metal oxide by releasing the free electrons from the adsorbed O2-, O- and O2- ions [6]. By detecting these changes, the metal oxide can be used as a gas sensor.
SnO2 nanoparticles are usually synthesized by precipitation [12], sol-gel [13], hydrothermal [14] and hydrolysis [15]. But these methods use chloride precursors, ammonia or hydroxide solutions to adjust pH and to form hydroxide nanoparticles. Thus, particle size and distribution is sensitive to the pH, using large amount of base solution and spend much time while reacting. To enhance these disadvantages, the plasma-assisted electrolysis process is adapted. Originally, this process is a method of converting metal surface into micro scale thickness oxide layer which is easily corroded in the air ambient such as aluminum, magnesium and titanium [16]. By controlling the conditions of the reaction, metal oxide nanoparticles can be produced instead of forming layers on the metal surface. The arc plasma forms when the current flow is limited by produced gases on the surface of the electrode. Nevertheless, some parts of the electrode are steel contacted with the electrolyte and due to increased current density, the local evaporating is continuously caused. Then, the formed gases envelop the electrode and lower the electrical conductivity. In this region, the electric field strength is enough to ionize the vapor in the gas envelop (106 ~ 108 V/m). Initially, sparks are rapidly formed in gas bubbles and transform into uniform glow by the vapor envelop. The hydrodynamic in this region is stabilized and drops the current density, causing the transformation of glow into intensive arc plasma [17]. As a result, the metal oxide is produced.
This paper focuses on controlling the particle size of a synthesized nano-sized particles and narrowing size distribution to use as a gas sensor by applying the plasmaassisted electrolysis process. Therefore, the concentration of electrolyte and frequency of the voltage condition was controlled. This process is a simple process that can reduce the environmental pollution by using small amount of electrolyte, the reaction time and continuous reaction is possible with the same electrolyte solution.
2.1. Preparation of tin oxide nanoparticles
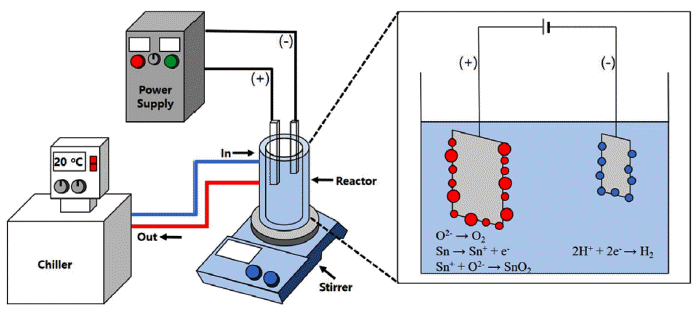
Tin metal plate was cut into piece (10 mm × 8 mm), put into the solution consist of D.I water with sulfuric acid electrolyte that can be seen in Fig. 1. The tin metal was put on an anode, a stainless steel mesh was connected to a cathode. The AC power supply (ACP-3KVA, Unicorn TMI Co.) was connected to the two electrodes. The stainless steel mesh (SUS 304, 60 mesh, The Nilaco Co.) was used to supply current equally to whole metal surface. Once the discharges were constantly produced after initial ignition, the condition was kept while proceeding reaction. Due to its high termperature and pressure during reaction, reactor was connected to the chiller (Haake SC 100, Thermo Scientific Co.) to control the solution temperature at 20°C effectively by cycling the solution with pump. Every reaction was finished within 5 minutes due to the quick reaction rate. Synthesized powder was gathered by centrifuge at 10,000 rpm. The powder was washed with an ultrasonic vibrator in DI water for 5 times to remove the electrolyte from the powder. The washed powder was calcinated at 600°C for 2 hours [18].
Fig. 1

Schematic diagram of plasma-assisted electrolysis process.

KPMI-24-351_F1.gif
2.2. Synthesis of tin oxide gas sensor
After the calcination, the obtained powder was mixed with α-terpineol in agate mortar for 30 minutes, mass ratio of 1 : 1, producing paste [19]. The paste was put on the slide glass in a line (2 mm × 20 mm), calcinated at 500°C to decompose the α-terpineol. After the calcination, the gold was sputtered above the paste to prepare the electrode (200 nm thickness). Before detecting the sensing property, the aging at the temperature of 350°C for 24 hours has been applied in air ambient to increase the stability. The gas sensing property was analyzed by current-voltage (IV) curve (NI PXle-1073, National Instruments Corporation, USA) and mass flow controller (Korea Instruments T&S). The crystal phase was observed by X-ray diffractometer (Rigaku D/MAX-2500/ PC, Kits), the morphology of the powder was analyzed by FE-SEM (Hitachi S-4800/Horiba EX-250, Rigong Int’l Inc) and the TEM image was obtained by Analytic STEM (JEM-2100F, Cs corrector, JEOL/CEOS).
3.1. Growth mechanism of SnO2 nanoparticles
As mentioned above, plasma electrolysis is a method to produce oxide layer on the metal surface to protect from corrosion. During this reaction, at the anode surface at low voltage, thin oxide layer is produced by anodization and increases surface resistance with insulating layer. It increases the voltage that applies to the anode and near the anode surface bubbling gaseous species such as oxygen, hydrogen, hydroxide and much other radical anions are produced by high electric voltage (400~600 V) which causes strong joul heating and electric field. Once the gas bubble starts to produce on the anode surface, oxygen and other gas species in gas bubble ionize and electron avalanche zone ignite discharges between electrolyte and metal. Then, arc or plasma discharges forms as bright light and exited electrochemical species penetrate into the anode and metal cations dissolves into the solution. Because arc plasma discharges produces high pressures and temperatures (pressure = 1 × 10² GPa, temperature 1 × 10⁴ °C) consistently, such produced anions and cations continuously react, nucleate and grow to be synthesized as nanoparticles [20].
3.2. Effect of electrolyte concentration
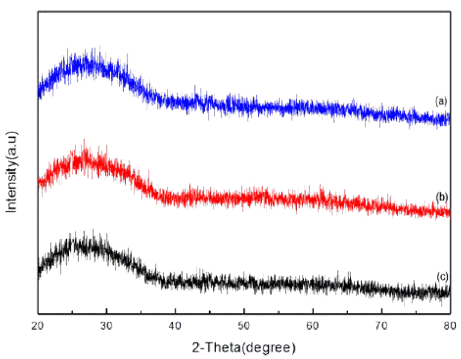
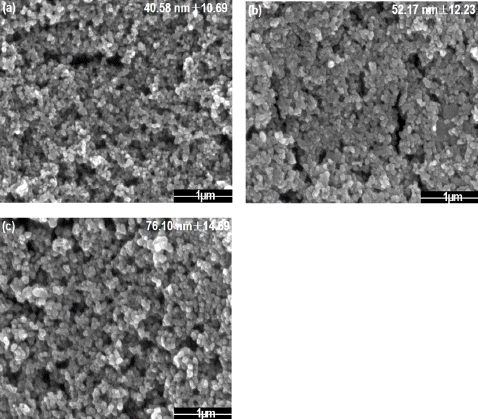
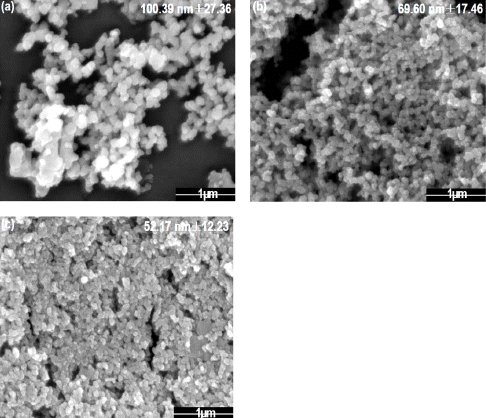
Fig. 2 and 3 shows the morphology and the XRD peak of tin dioxide nanoparticle with the different electrolyte concentration by 5, 7 and 10 mM of sulfuric acid under the voltage of 500 V, 100 Hz. The peak showed almost amorphous state due to the physically adsorbed and chemically bonded water molecules [21]. When the concentration of the electrolyte changed by 5, 7 and 10 mM, the particles size decreased from 100 to 52 nm. When the electrolyte concentration which is sulfuric acid increases, acidity of the solution decreases that is related to the ratio of proton and cations. The Sn ions melted down from the plate should react with cations in solution such as O2- to form nanoparticles however, lower acidity indicates the lower degree of cations. As a result, it restricts the formation of nanoparticles and reduces nanoparticles size by increasing electrolyte concentration. For the maximization of gas sensing property, 10 mM electrolyte concen- tration condition was fixed for further analysis.
Fig. 2

FE-SEM images of tin dioxide nanoparticle synthesized by plasma-assisted electrolysis process with sulfuric acid electrolyte, (a) 5mM, (b) 7 mM, and (c) 10mM.

KPMI-24-351_F2.gif
Fig. 3

XRD patterns of tin dioxide nanoparticle by changing the mole of electrolyte (a) 5 mM (b) 7 mM (c) 10 mM.

KPMI-24-351_F3.gif
3.3. Effect of voltage frequency
Fig. 4 shows the morphology of the tin dioxide nanoparticle with the different value of frequency by 50, 100, 200 Hz of the power supply in a condition of 500 V. When the frequency increased, the particle size increased from 40 to 76 nm. If the frequency increases, the number of spot where the plasma forms on the metal surface also increases. It contributes the metal to melt continuously without enough time for cooling. Therefore, it could not give sufficient time to form nanoparticle by continuous formation of plasma, resulting in an agglomeration, forming large particles [22]. To be used as gas sensor with large surface area, smallest nanoparticle synthesis condition which is 50 Hz was chosen for optimum state.
Fig. 4

FE-SEM images of tin dioxide nanoparticle by changing the frequency (a) 50Hz (b) 100Hz (c) 200Hz.

KPMI-24-351_F4.gif
3.3. Effect of calcination
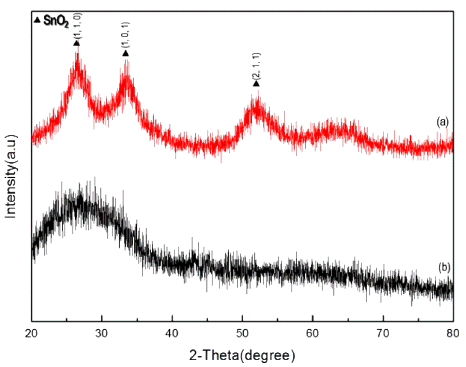
Fig. 5 and 6 shows XRD peak of synthesized tin oxide nanoparticle and the peak after calcination of 600°C. Synthesized tin oxide nanoparticle showed almost amorphous state without specific peaks. But after the calcination, the peaks perfectly match with JCPDS card no. 41- 1445 which indicates structure of tetragonal phase tin oxide with (110), (101) and (210) respectively. At higher temperature of calcination, the XRD peak became sharper. It indicates that grain size and the crystallinity can be controlled by calcination temperature.
Fig. 5

XRD patterns of nanoparticle (a) after calcination at 600°C and (b) before calcination.

KPMI-24-351_F5.gif
Fig. 6

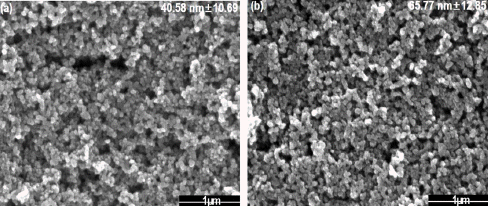
FE-SEM images of synthesized nanoparticle calcinated at 10 mM sulfuric acid (a) before calcination and (b) after calcination at 600°C.

KPMI-24-351_F6.gif
3.4. TEM analysis
Fig. 7(a) shows the HR-TEM images of resulting tin dioxide nanoparticles synthesized using plasma-assisted electrolysis process with the size of 40 nm at the condition of 10 mM of sulfuric acid electrolyte, 500 V and 50 Hz. It matches with the SEM analysis of the above results that the spherical morphology nanoparticles are well developed with the narrow size distribution. Fig. 7 (b) shows the surface of the single nanoparticle with the distance between the lattice fringe shows value of 0.33 and 0.26 nm corresponding to the spacing of tetragonal tin dioxide by direction of (110) and (101) respectively. Fig. 7 (c) shows the Fast Fourier transform (FFT) pattern. The bright ring of the pattern indicates each ring is consist of (110), (101), (211) directions. It matches with the polycrystalline nature of nanostructure tin dioxide particle as can be seen in Fig. 7 (b).
Fig. 7

TEM images of tin dioxide powder (a) as-prepared nanoparticle at low resolution (b) at high resolution (c) FFT pattern.

KPMI-24-351_F7.gif
3.5. Gas sensing property
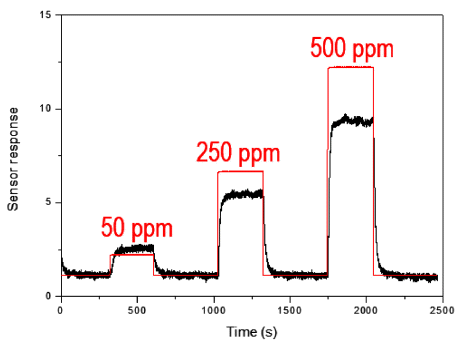
The condition of synthesizing tin dioxide nanoparticle was 500 V, 10 mM of sulfuric acid and 50 Hz for 5 minutes due to the smaller size of the whole condition to increase the specific surface area. The sensing performed at 5 V and the temperature of 350°C. The determination of sensing response was plotted as a ratio of Ra/Rg, where the Ra is the steady-state initial resistance and Rg is the resistance of air-gas mixture in air ambient [23]. Fig. 8 shows the property of as-prepared tin dioxide nanoparticle- based gas sensor of hydrogen sulfide. The flow rate of the gas was 50, 250 and 500 ppm. The response and recovery times were shorten through increasing gas flow rate with 30 and 23, 15 and 25, 12 and 21 s respectively. The time was determined by returning to the 90% of its initial resistance T90%. When the gas flows, it reacts with the oxygen ions adsorbed on the grain boundaries on the tin dioxide nanoparticle, eliminating oxygen ions. It releases the free electrons into the particle grain boundaries which were captured by the oxygen ions. As a result, the resistance decreases. When the gas was turned off, the oxygen again adsorbs on the metal surface forming oxygen ions. It caused the resistance to be increased. When the gas flow rate increases by 50, 250 and 500 ppm, the sensor sensitivity also increased.
Fig. 8

Sensing properties of as-prepared tin dioxide gas sensor with sensor response and gas flow rate.

KPMI-24-351_F8.gif
Tin dioxide nanoparticle could be obtained by using newly process of plasma-assisted electrolysis. By controlling the condition of the reaction such as electrolyte concentration and frequency of the voltage, the particle size could be controlled from 100 to 40 nm. The condition of synthesizing nanoparticles was chosen to be the smallest nanoparticles to be used as a gas sensor which was 500 V and 50 Hz. After the reaction, the synthesized particle was calcinated at 600°C for 2 hours to evaporate the bonded water molecules and increase the crystallinity. This powder was mixed with terpineol to produce paste, put on a glass and calcinated at 500°C for 2 hours to decompose the terpineol, producing tin dioxide nanoparticle-based gas sensor. The gas sensing performed at the temperature of 350°C with hydrogen sulfide gas. It showed potential application as detecting characteristic with enhancing sensitivity when the flow rate of gas increased. By investigating the new environmental friendly process of synthesizing nanoparticles, it has shown great potential in industrial applications.
Acknowledgements
This study was supported by the R&D Center for Valuable Recycling(Global-Top R&BD Program) of the Minis try of Environment (Project No.:2016002250005) and Industrial Critical Technology Development Program (10062526, Development of Chalcogenide-based Ceramic Composites for Energy-efficient Windows (visible light transmission, >70%, infrared cutoff, >90%)) funded by the Ministry of Trade, Industry & Energy, Republic of Korea.
  • 1. N. Yamazoe, G. Sakai and K. Shimanoe: Catal. Surv. Asia., (2003) 7 63.Article
  • 2. H. Huang, O.K. Tan, Y.C. Lee, T.D. Tran, M.S. Tse and X. Yao: Appl. Phys. Lett.., (2005) 87 163123.
  • 3. J.F. Mcaleer, P.T. Moseley, J.O. Norris, D.E. Williams, P. Taylor and B.C. Tofield: Mater. Chem. Phys.., (1987) 17 577.Article
  • 4. R.S. Niranjans and I.S. Mulla: Mater. Eng. B., (2003) 103 103.
  • 5. J. Watson, K. Ihokura and G.S. Coles: Meas. Sci. Technol.., (1993) 4 711.
  • 6. I.S. Imtiaz, N.S. Niranjan, Y.K. Hwang and J.S. Chang: J. Ind. Eng. Chem.., (2004) 10 1242.
  • 7. R.E. Presley, C.L. Munsee, C.H. Park, D. Hong, J.F. Wager and D.A. Keszler: J. Phys. D Appl. Phys.., (2004) 37 2810.
  • 8. G. Jain and R. Kumar: Opt. Mater.., (2004) 26 27.
  • 9. P. Meduri, C. Pendyala, V. Kumar, G.U. Sumanasekera and M.K. Sunkara: Nano Lett.., (2009) 9 612.
  • 10. J. Stephens, A.K. Batra and J.R. Currie: Mater. Sci. Appl.., (2012) 3 448.
  • 11. R.K. Srivastava, P. Lai, R. Dwivedi and S.K. Srivastava: Sens. Actuator B., (1994) 21 213.
  • 12. K.C. Song and Y. Kang: Mater. Lett.., (2000) 42 283.
  • 13. V. Briois, S. Belin, M.Z. Chalaca, R.H. Santos, C.V. Santilli and S.H. Pulcinelli: Chem. Mater.., (2004) 16 3885.
  • 14. G.E. Patil, D.D. Kajale, V.B. Gaikwad and G.H. Jain: Int. Nano Lett.., (2012) 2 17.
  • 15. C. Ribeiro, E.J. Lee, T.R. Giraldi, E. Longo, J.A. Varela and E.R. Leite: J. Phys. Chem. B., (2004) 108 15612.
  • 16. A.L. Yerokhin, X. Nie, A. Leyland and A. Matthews: Surf. Coat. Tech.., (2000) 130 195.
  • 17. A. Lugovskoy and M. Zinigrad, Materials Science – Advanced Topics., Intech, United Kingdom Yizhak Mastai, (2013) 85.
  • 18. H.H. Son and W.G. Lee: Surf. Interface Anal.., (2012) 44 989.
  • 19. Y. Zong, Y. Cao, D. Jia and P. Hu: Sens. Actuators B Chem.., (2010) 145 84.
  • 20. T.H. Kim, N.S. Eom, S.O. Kang and Y.H. Choa: RSC Advances., (2016) 6 20337.
  • 21. S. Abbasi, F.G. Fard, S.M. Mirhosseini, A. Ziaee and M. Mehrjoo: Mater. Sci. Eng. C., (2013) 33 2555.
  • 22. X. Zhang, Y. Zhang, L. Chang, Z. Jiang, Z. Yao and X. Liu: Mater. Chem. Phys.., (2012) 132 909.
  • 23. L. Mei, Y. Chen and J. Ma: Sci. Rep.., (2014) 4 602.

Figure & Data

References

    Citations

    Citations to this article as recorded by  
    • Effects of porosity and particle size on the gas sensing properties of SnO2 films
      Min Ah Han, Hyun-Jong Kim, Hee Chul Lee, Jin-Seong Park, Ho-Nyun Lee
      Applied Surface Science.2019; 481: 133.     CrossRef

    • PubReader PubReader
    • Cite this Article
      Cite this Article
      export Copy Download
      Close
      Download Citation
      Download a citation file in RIS format that can be imported by all major citation management software, including EndNote, ProCite, RefWorks, and Reference Manager.

      Format:
      • RIS — For EndNote, ProCite, RefWorks, and most other reference management software
      • BibTeX — For JabRef, BibDesk, and other BibTeX-specific software
      Include:
      • Citation for the content below
      The Synthesis Method of Tin Dioxide Nanoparticles by Plasma-Assisted Electrolysis Process and Gas Sensing Property
      J Korean Powder Metall Inst. 2017;24(5):351-356.   Published online October 1, 2017
      Close
    • XML DownloadXML Download
    Figure
    • 0
    • 1
    • 2
    • 3
    • 4
    • 5
    • 6
    • 7
    The Synthesis Method of Tin Dioxide Nanoparticles by Plasma-Assisted Electrolysis Process and Gas Sensing Property
    Image Image Image Image Image Image Image Image
    Fig. 1 Schematic diagram of plasma-assisted electrolysis process.
    Fig. 2 FE-SEM images of tin dioxide nanoparticle synthesized by plasma-assisted electrolysis process with sulfuric acid electrolyte, (a) 5mM, (b) 7 mM, and (c) 10mM.
    Fig. 3 XRD patterns of tin dioxide nanoparticle by changing the mole of electrolyte (a) 5 mM (b) 7 mM (c) 10 mM.
    Fig. 4 FE-SEM images of tin dioxide nanoparticle by changing the frequency (a) 50Hz (b) 100Hz (c) 200Hz.
    Fig. 5 XRD patterns of nanoparticle (a) after calcination at 600°C and (b) before calcination.
    Fig. 6 FE-SEM images of synthesized nanoparticle calcinated at 10 mM sulfuric acid (a) before calcination and (b) after calcination at 600°C.
    Fig. 7 TEM images of tin dioxide powder (a) as-prepared nanoparticle at low resolution (b) at high resolution (c) FFT pattern.
    Fig. 8 Sensing properties of as-prepared tin dioxide gas sensor with sensor response and gas flow rate.
    The Synthesis Method of Tin Dioxide Nanoparticles by Plasma-Assisted Electrolysis Process and Gas Sensing Property

    Journal of Powder Materials : Journal of Powder Materials
    TOP