Articles
- Page Path
- HOME > J Korean Powder Metall Inst > Volume 26(4); 2019 > Article
-
ARTICLE
- Modeling the Density and Hardness of AA2024-SiC Nanocomposites
- A-Hyun Jeon, Hong In Kim, Hyokyung Sung, N. S. Reddy*
-
Journal of Korean Powder Metallurgy Institute 2019;26(4):275-281.
DOI: https://doi.org/10.4150/KPMI.2019.26.4.275
Published online: July 31, 2019
Virtual Materials Lab, Department of Metallic & Materials Engineering, School of Materials Science and Engineering, Engineering Research Institute, Gyeongsang National University, 501, Jinju-daero, Jinju, Gyeongsangnam-do 52828, Republic of Korea
- *Corresponding Author: N. S. Reddy, TEL: +82-55-772-1669, FAX: +82-55-772-1669, E-mail: nsreddy@gnu.ac.kr
- - 전아현 · 김홍인: 학생, 성효경 · N. S. Reddy: 교수
© The Korean Powder Metallurgy Institute. All rights reserved.
- 799 Views
- 3 Download
Abstract
- An artificial neural network (ANN) model is developed for the analysis and simulation of correlation between flake powder metallurgy parameters and properties of AA2024-SiC nanocomposites. The input parameters of the model are AA 2024 matrix size, ball milling time, and weight percentage of SiC nanoparticles and the output parameters are density and hardness. The model can predict the density and hardness of the unseen test data with a correlation of 0.986 beyond the experimental data. A user interface is designed to predict properties at new instances. We have used the model to simulate the individual as well as the combined influence of parameters on the properties. Moreover, we have analyzed the calculated results from the powder metallurgical point of view. The developed model can be used as a guide for further composite development.
- AA2024 is a heat-treatable high strength aluminum alloy composed of Al, Cu, and Mg which is widely used in the automotive and aerospace industries. SiC particles are unique and significant ceramic reinforcement in the manufacture of ceramic particle reinforced metal matrix composites (MMC) in line for its superior properties such as low density, excellent thermal stability, high hardness, and high wear resistance [1, 2]. Ceramic particle reinforced MMCs have been fabricated through various methods. The fabrication procedures such as ball milling, hot pressing, and hot extrusion are used to offer an enhancement in the density of compacts and the consistent distribution of reinforcement particles within the ductile matrix. Although these methods increase the density, they are inadequate for homogeneous distribution of the reinforcing particles in the matrix. Mechanical milling is an excellent method for the homogeneous distribution, however, ductile matrix powders become brittle, and the densification ability of matrix powder decreases with increasing milling time. Flake powder metallurgy technique offers homogeneous distribution of reinforcement particles in the matrix and higher density [3, 4]. The literature studies reveal that the particle size of reinforcement materials, the weight percentage of reinforcement material, consolidation pressure, process temperature significantly affect the reinforcement distribution and properties of MMCs. Temel Varol et al. published neural networks studies based on the prediction of the effect of flake size, flake time and wt% of SiC on the properties of Al-SiC nanocomposites by flake powder metallurgy method [4]. In the present study we used the same experimental data as of Varol et al., and correlated the relationship between the properties and parameters and also predicted the properties beyond the experimental data. Developed model was used for prediction of the effect of matrix size, milling time and SiC content on the density and hardness of Al-SiC nanocomposites fabricated by flake powder metallurgy.
1. Introduction
- 2.1 Experimental data
- Experimental data of mechanical milling performed in a planetary ball mill using tungsten carbide vial and balls of AA2024-SiC nanocomposites collected from the published work [5]. The data consists of the average size of AA2024 powders, milling time and SiC content and respective density and hardness of nanocomposites. The experimental procedure was well reported in detail [5], and the statistics of the data used for building an artificial neural networks (ANN) model was shown in Table 1.
- 2.2 ANN Methodology
- ANN model comprises an input layer and an output layer with as many units as their corresponding quantity of variables. Separating the input and output layers are the hidden layers, with several nodes. The number of nodes depends comprehensively on the system and the satisfactory error of the model. The error-correction phase takes place after a pattern is offered at the input layer, and the forward propagation is accomplished. Each processing component in the output layer produces a real number as its output, which is related to the actual output stated in the training set. Based on this variance, an error is calculated for each unit in the output layer. The weights of these units are adjusted for all of the interconnections that are recognized with the output layer. Subsequently, other sets of weights are changed for all the interconnections approaching into the hidden layer that is just below the output layer. The procedure is continued until the weights of the primary hidden layer are in tune. Thus, the modification starts with the output units and spreads backward through each hidden layer to the input layer. Hence the term back-error propagation or backpropagation (BP) [6]. A BP system is trained through a supervised learning mechanism. The network is presented with inputs and respective targeted outputs in the training phase. Upon each appearance, the weights are adjusted to lessening the error among the networks’ output and the targeted output [7]. A comprehensive illustration of the BP algorithm used in the current study can be found in the literature [8]. The training of the ANN model was carried out by using the software code written in programming language C, and sigmoid function was used as an activation function with the BP training algorithm. From the 36 available data, database partitioned into 26 datasets for training and 10 datasets for testing.
2. Materials and Methods
- 3.1 Optimization of ANN model hyperparameters.
- Results achieved from training are discussed in detail in this section and presented in Figure 1. In this study, the optimal hyperparameters of the network are determined based on the minimum mean sum square (MSE) error and the average error in output prediction of the data. The optimum hyperparameters, i.e., the number of hidden layers and neurons in hidden layers, learning rate and momentum rate and iterations, are obtained by trial and error method and explained in step by step.
The network trained initially with a single hidden layer, then two hidden layers, and finally with three hidden layers. Each hidden layers consists of 2 to 10 neurons in layer. We found that with a single hidden layer comprised of 7 hidden nodes given a minimum average error for test data, this architecture, 3-7-2, (Figure 1(a)) used for identifying other hyperparameters.
We varied the momentum term from 0.1 to 0.9, and we obtained 0.5 momentum term is the minimum values of test error as shown in Figure 1 (b).
With 0.5 momentum term, we varied learning rate from 0.1 to 0.9, and we found 0.3 is better value with minimum errors.
With 3-7-2 architecture with 0.5 momentum term and 0.3 learning rate, we varied the number of iterations, and we observed at 9000 iterations the test error is minimum, and afterward, the error started increasing as shown in Figure 1(c) and (d). Hence, we stopped the training at 9000 iterations to avoid overfitting [9].
- In this process of the model development, the initial values of the 3-7-2 ANN architecture, i.e., 44 (4X7+ 8X2), weights are generated between -0.5 and +0.5. The ideal ANN model weights were transformed between - 7.6 to 7.14. The magnitude and direction of these weights are capable of mapping the relationship between inputs and outputs. Once the model is chosen, it is possible to use it to compute the density and hardness of AA2024- SiC nanocomposite as long as the data are within the predictive range (see Table 1). The transformation of the weights of the model, as shown in Table 2.
- 3.2 Performance of the developed model
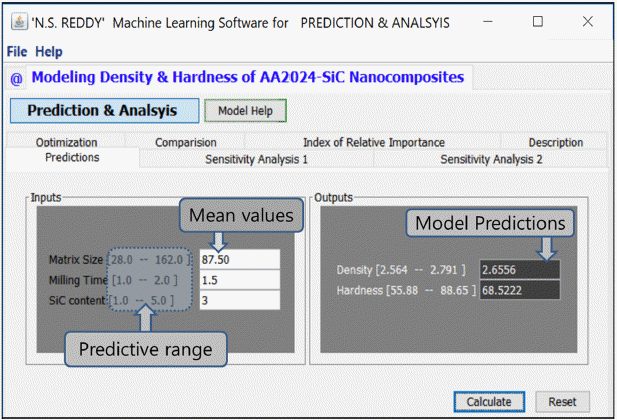
- Figure 2 shows the comparison between actual and predicted density and hardness of training and testing data. From Figure 2, it is evident that the predictions are in good agreement with the experimental values for training (R2=0.99) as well as for testing data sets (R2=0.9865). Figure 3 shows the graphical user interface of the developed model. The available experimental data is limited to only 36 sets. But within this range, there are an infinite number of experiments were possible. Figure 3 shows predicted density and hardness at mean values of AA 2024 matrix size, ball milling time, and SiC content. The developed model can predict the properties with reliable accuracy. Based on accuracy in predictions, we can understand that the model can map the relationship between inputs and outputs of AA2024-SiC nanocomposites.
- The graphical user interface of the developed ANN model. A virtual experimental system with mean values of the database and its predicted properties.
- 3.3 Sensitivity analysis
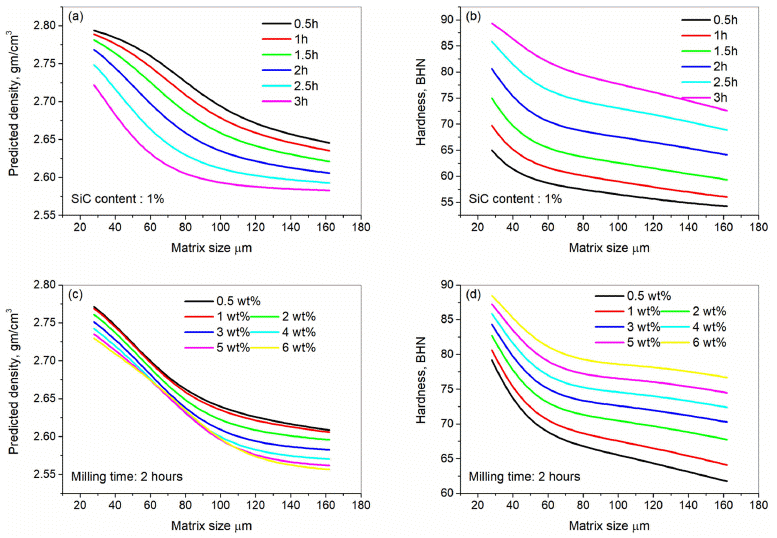
- Figure 4 shows the predicted effect of variation of matrix size from 28 to 162 μm on properties at different milling times and SiC content. The experimental data available only at 1, 1.5, and 2 h of milling time. The model ( sensitivity analysis tab is shown in Figure 3) asked to predict the properties at 0.5, 2.5, and 3h. Even though the experimental data of SiC content exists only at 1, 3, and 5 wt%, the model predicted at 0.5, 2, 4, and 6 wt%. In principle, the neural networks models are known for approximation and interpolation within the expected range of the data. Surprisingly, in this case, the model predictions beyond the experimental data are in good agreement with the trend of density and hardness behavior.
- Effect of matrix size on properties at different milling times and varying wt% of SiC content.
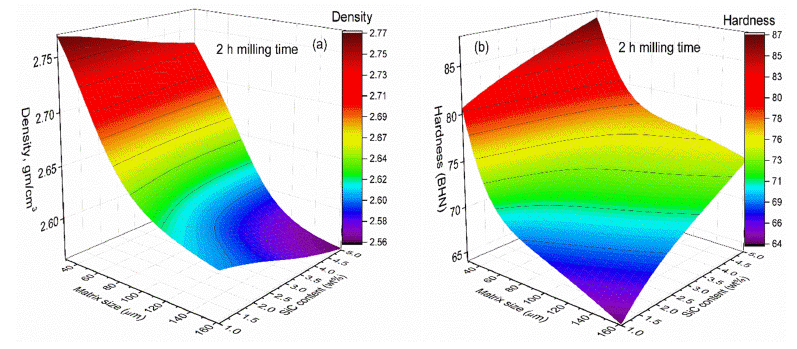
- Figure 5 shows the predicted density and hardness as a function of matrix size and SiC content at 2-h milling time (by using the sensitivity analysis 2 tab in Figure 3). Here every point indicates an experimental condition and respective property. The predicted high values of density and hardness occur at lower AA2024 matrix values. With an increase in matrix size, the properties decrease linearly. Whereas the smaller amounts of SiC content results in high density and high quantities of SiC content results in high hardness. The tendencies of density and hardness predictions values are similar to experimental knowledge. User interface generated by using an ideal model offer untested experimental results with reasonable accuracy.
- combined effect of matrix size and SiC content at 2 h milling time (a) density (b) hardness.
- 3.4 Finding the index of relative importance.
- We calculated the index of relative importance (IRI) [10] for the highest and lowest values of density and hardness in the experimental data. The nature and magnitude of IRI indicate the significance of the input parameters on the density and hardness. All variable prominence on properties is reported on a whole data set [11, 12]. In this paper, the instant relative significance of the inputs on the two properties has been assessed. While one input was varied with a ±5% offset, the other two inputs were kept constant. After adding the ±5% variation to all the inputs, six combinations of input data were created. These data were fed to the ANN model to predict the respective density and hardness and thereby to calculate (IRI) of each input parameter.
- We considered four samples with minimum and maximum properties in the database and identified the significance of parameters qualitatively by calculating the index of relative importance (IRI). Figure 6 (a) and (b) shows estimated IRI values for the density and hardness, respectively. The main factors for the formation of high density are estimated due to the smaller amounts of matrix size, SiC content, and milling time. Low density was due to the higher values of input parameters. In the case of hardness, a small amount of matrix size, high SiC (5%) and milling time favor for superior properties and vice versa.
3. Results and Discussion
-
The artificial neural networks model has been used to predict density and hardness as a function of matrix size, ball milling time, and weight % of SiC particles.
ANN models are data-driven models; the predicted results are in a good agreement with the experimental results. The results show that it is a potentially practical tool with reliable accuracy for determining density and hardness of AA2024-SiC nanocomposites.
ANN model predictions beyond the experimental data are surprising matches with experimental knowledge.
The impact of parameters on properties was represented by sensitivity analysis and index of relative importance method.
4. Conclusions
-
Acknowledgements
- NSR acknowledges YSJ – DPR for the inspiration and YKK for the model development.
Acknowledgments
- 1. A. Canakci and T. Varol: Powder Technol., 268 (2014) 72..Article
- 2. A. Hassani, E. Bagherpour and F. Qods: J. Alloys Compd., 591 (2014) 132..Article
- 3. T. Varol and A. Canakci: Met. Mater. Int., 21 (2015) 704..Article
- 4. T. Varol and A. Canakci: J. Alloys Compd., 649 (2015) 1066..Article
- 5. T. Varol, A. Canakci and S. Ozsahin: J. Alloys Compd., 739 (2018) 1005..Article
- 6. R. P. Lippmann: IEEE ASSP Magazine, 4 (1987) 4. .Article
- 7. D. E. Rumelhart, G. E. Hinton and R. J. Williams: Nature, 323 (1986) 533..Article
- 8. M. H. Hassoun: Fundamentals of Artificial Neural Networks, The MIT Press, Cambridge, Massachusetts, London, England, (1995)..
- 9. H. K. D. H. Bhadeshia: ISIJ International, 39 (1999) 966..Article
- 10. N. S. Reddy, B. B. Panigrahi, M. H. Choi, J.-H. Kim and C. S. Lee: Comput. Mater. Sci., 107 (2015) 175..Article
- 11. V. Y. Quintanilla, A. Verliefde, T.-U. Kim, A. Sadmani, M. Kennedy and G. Amy: J. Membr. Sci., 342 (2009) 251..Article
- 12. J. D. Olden, M. K. Joy and R. G. Death: Ecol. Modell., 178 (2004) 389..Article
Figure & Data
References
Citations

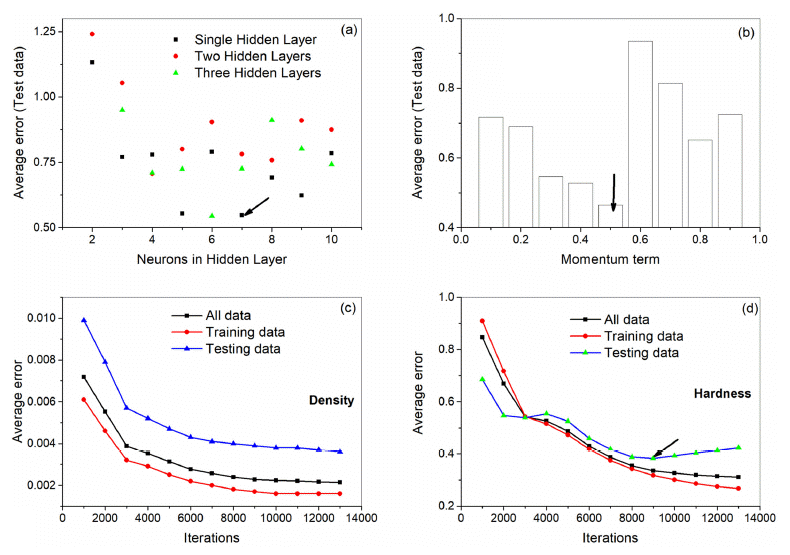
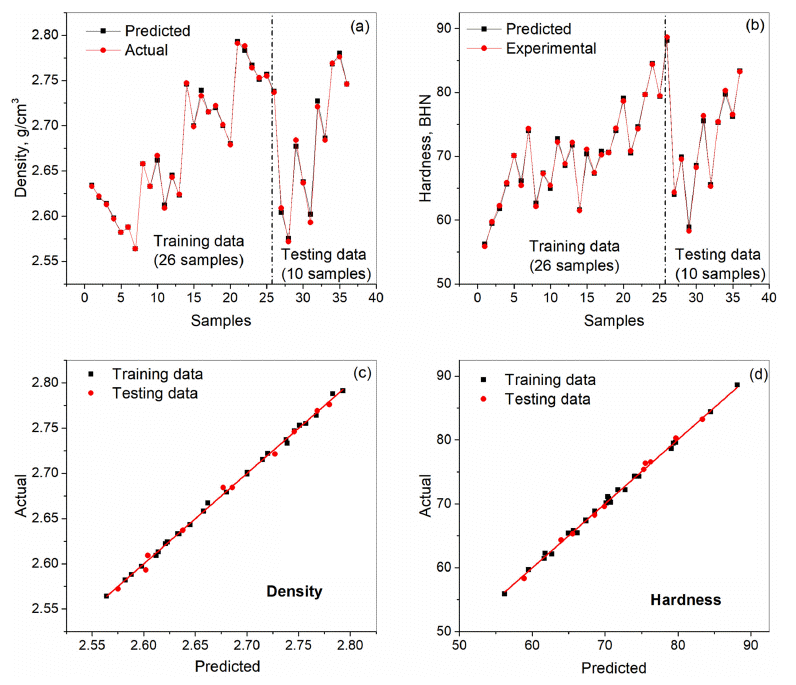


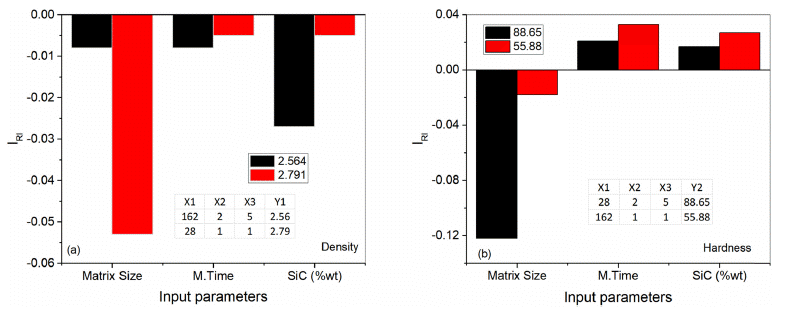
Figure 1
Figure 2
Figure 3
Figure 4
Figure 5
Figure 6
Table 1
Table 2
TOP
 KPMI
KPMI


 Cite this Article


