Articles
- Page Path
- HOME > J Korean Powder Metall Inst > Volume 27(5); 2020 > Article
-
Article
- Correlation of Sintering Parameters with Density and Hardness of Nano-sized Titanium Nitride reinforced Titanium Alloys using Neural Networks
- A. K. Mauryaa,b, P. L Narayanaa,b, Hong In Kima, N. S. Reddya,*
-
Journal of Korean Powder Metallurgy Institute 2020;27(5):365-372.
DOI: https://doi.org/10.4150/KPMI.2020.27.5.365
Published online: September 30, 2020
a School of Materials Science and Engineering, Engineering Research Institute, Gyeongsang National University, Jinju 52828, Republic of Korea
b Advanced Metals Division, Titanium Department, Korea Institute of Materials Science, Changwon 51508, Republic of Korea
- *Corresponding Author: N. S. Reddy, TEL: +82-55-772-1669, FAX: +82-55-772-1670, E-mail: nsreddy@gnu.ac.kr
- - A. K. Maurya, P. L Narayana, H. I. Kim: 학생, N. S. Redddy: 교수
© The Korean Powder Metallurgy Institute. All rights reserved.
- 1,143 Views
- 6 Download
- 1 Crossref
Abstract
- Predicting the quality of materials after they are subjected to plasma sintering is a challenging task because of the non-linear relationships between the process variables and mechanical properties. Furthermore, the variables governing the sintering process affect the microstructure and the mechanical properties of the final product. Therefore, an artificial neural network modeling was carried out to correlate the parameters of the spark plasma sintering process with the densification and hardness values of Ti-6Al-4V alloys dispersed with nano-sized TiN particles. The relative density (%), effective density (g/cm3), and hardness (HV) were estimated as functions of sintering temperature (°C), time (min), and composition (change in % TiN). A total of 20 datasets were collected from the open literature to develop the model. The high-level accuracy in model predictions (>80%) discloses the complex relationships among the sintering process variables, product quality, and mechanical performance. Further, the effect of sintering temperature, time, and TiN percentage on the density and hardness values were quantitatively estimated with the help of the developed model.
- In recent years, nanostructured bulk materials got great attention due to their unique mechanical properties such as high strength, toughness, ductility, stiffness, wear, and fatigue resistance [1, 2]. One of the main advantages of nanostructured bulk materials is their nano scaled grain size, which is generally achieved by the intentional addition of nanoparticles, nanotubes, and nanowires [1]. Sintering is the most commonly used process for the production of nanostructured bulk materials via the consolidation of powders. Among various sintering techniques, the spark plasma sintering has been proven that it is a suitable method for the production of nanostructured bulk materials due to its lower sintering temperature and shorter holding times, which produces high-quality products[ 3-5]. In brief, spark plasma sintering (SPS) is a novel pressure-assisted pulsed electric current sintering process utilizing On-OFF DC pulse energizing [6, 7].
- However, there still exist many obstacles in the mass production of high-quality defect-free nanostructured materials with minimal agglomeration, homogeneous dispersion of nanoparticles, and well-densified materials [1]. In order to obtain such products, it is very important to understand the influence of process variables on the final product quality during the fabrication. In particular, the quality and properties (i.e., relative density, effective density, and hardness) of SPS processed products mainly depend on sintering conditions such as temperature, time, heating rate, sintering pressure [8]. Due to non-linear and complex relationships among process variables, this is a challenging task to get the optimized process variable to obtain the desired sintered materials. Therefore, there is a need for computational tools for a better understanding of the non-linear relationships among the process variables.
- The artificial neural network model (ANN) is one of the best computational tools that has been used in many metallurgical- related issues. The advantage of this model is not limited to correlate the non-linear variables but also able to provide the optimum set of input variables to get the desired output[9]. The ANN model has been used to solve the various materials science problems in which relation is not clear between the dependent and independent parameters[10-13]. Hence, the present study focused on the development of an ANN model to investigate the influence of the process variables (vol.% of TiN, temperature, and sintering time) on the densification and hardness of SPS processed nano-sized TiN modified Ti- 6Al-4V alloys.
1. Introduction
- ANN model is a biologically inspired computational program, designed to simulate various complex problems [14]. ANN contains neurons connected with weights (coefficients), which form the neural network, and the power of neurons comes from connecting weights in the network [15]. ANN model gathers their knowledge by detecting the relationship between experimental datasets, and this phenomenon is called training and testing of the model [9, 15]. The accuracy of the model depends on the smallest error in prediction during training [13]. The present model utilizes the 20 experimental datasets (12 datasets for training and the remaining eight datasets for testing as represented in Table 1) collected from the published literature [8]. Total three process parameters such as vol.% of TiN, sintering temperature, and time are considered as input parameters, whereas relative density, effective density, and hardness are considered as output parameters of the model. The backpropagation algorithm using a sigmoid activation function is used to develop the ANN model [16]. The model development and training procedure are explained in Fig. 1 [12-14].
- Since there are three different outputs in the original datasets, so to get high accuracy in prediction, we trained three independent models for each output parameter. Here are three independent ANN models developed, including relative density, effective density, and hardness. Here we are representing the training procedure for the relative density model, only same traing procedure used for the other two models.
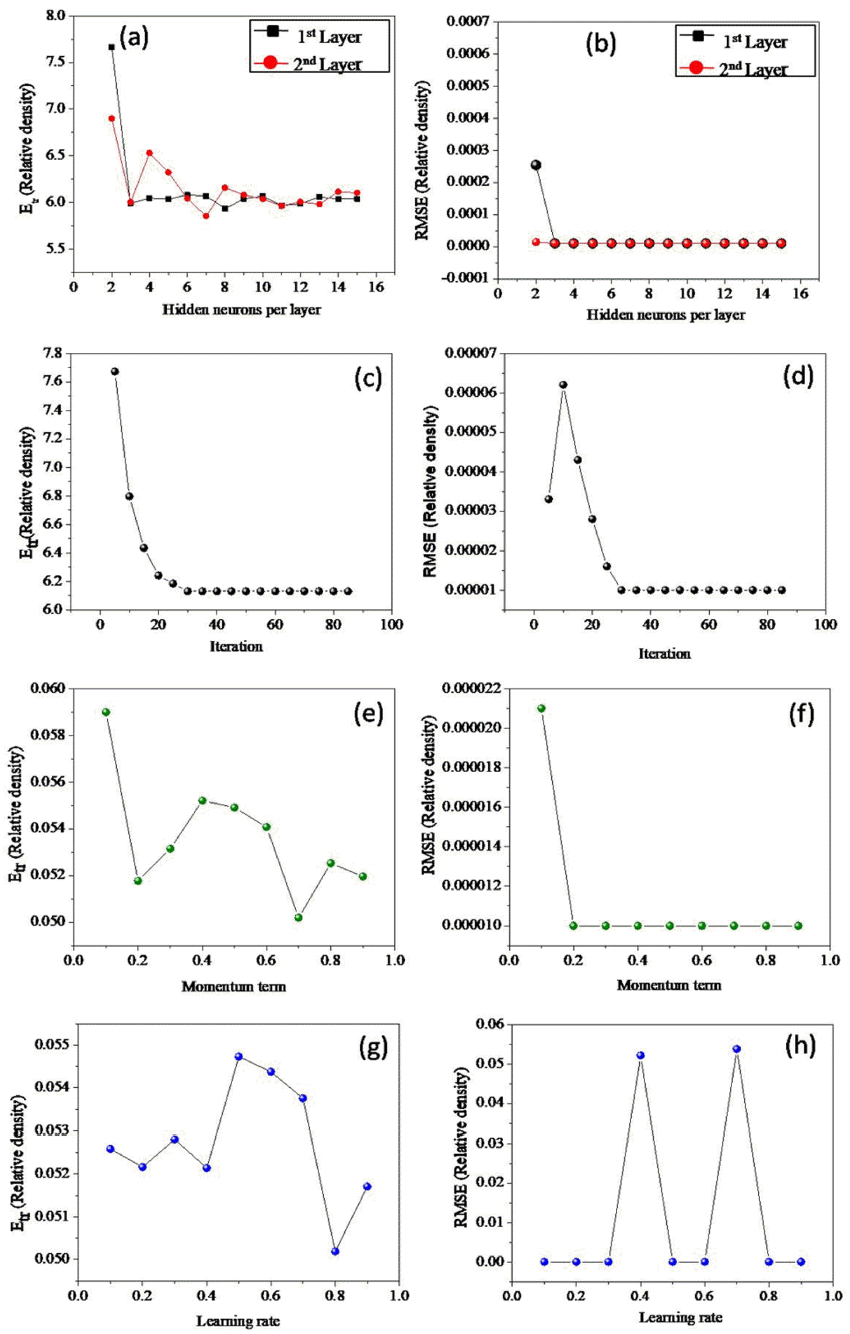
- The training was accompanied that the predicted output data should be close to the experimental data sets. The entire data sets are divided into training and testing. The training data sets were used to develop the model, whereas the testing data sets were used to evaluate the model development. The optimum model structure was obtained by varying the model hyperparameters, such as the number of hidden layers, neurons in the hidden layers, number of iteration, momentum term, and learning rate. These parameters were selected based on the minimum root mean error (RMSE) and the average minimum deviation in output prediction (Etr) of the train and test data sets, as shown in Fig. 1 [12-14].
- The optimum architecture of the ANN model was obtained by testing with a single hidden layer and two hidden layers. In the first case, the model was trained with one hidden layer with an initial momentum rate of o.4, learning rate 0.6, and the number of iteration 50000 by varying hidden neurons from 2 to 15. The single layer with eight neurons achieved a minimum Etr 6.068 and RMSE 0.00001 (Fig. 1a and 1b, respectively). Similarly, the two hidden layers trained with the same set of parameters, and the minimum value achieved at seven hidden neurons per layer with Etr 5.9 and RMSE 0.00001, as shown in Fig. 1a & 1b. Hence the seven hidden neurons in two hidden layers were selected for further optimization of other hyperparameters due to minimum Etr and RMSE value. The iteration of the model was optimized by keeping momentum rate of 0.4, a learning rate of 0.6 with two hidden layers, each with seven neurons. The variation of errors as a function of iterations from 5000 to 85000 shown in figure 1, and the minimum Etr 6.13 and RMSE 0.00001 observed at 30000 iterations. Finally, by varying the momentum term and learning rate from 0.1 to 0.9, we achieved minimum deviation in predictions at momentum term 0.7 (Fig. 1e and 1f) and learning rate 0.8 (Fig. 1g and 1h). The same procedure applied to get optimum hyperparameters in the other two models (effective density and hardness). Once the model hyperparameters are obtained, the model validation confirms by using test data sets.
- The optimized hyperparameters for three ANN models, namely: hidden layer with hidden neurons, momentum term, learning rate, and the number of iterations, are shown in Table 2. This proposed model contains three neurons in the output layer; represent input parameters and one output neurons in the output layer. Each model contains two hidden layers; each contains six and seven neurons as shown in Table 2. The schematic diagram of the model congaing two hidden layers with six neurons in each layer with input and output layers is shown in Fig. 2.
2. Model development
The database used for the present study
Variation of average error in prediction (Etr) and RMSE of fiber diameter as a function of (a) & (b) hidden neurons per layer (c) & (d) Iterations (e) & (f) momentum term (g) & (h) learning rate.
- 3.1. Weights distribution and model validation
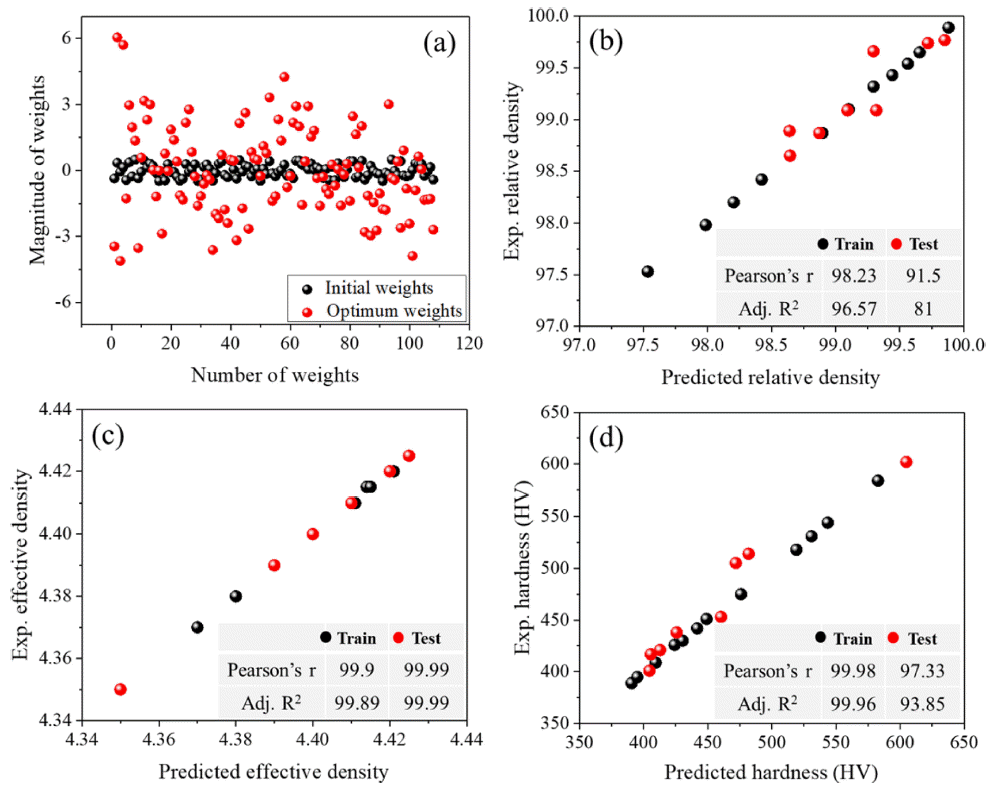
- Artificial neurons connected with coefficient, called weights (memory units) [16, 17].Weights are processing elements in the neural network which transfer information through neurons to the entire neural network system. The magnitude and direction of the weights are the responsible factors that represent the relationship between output and input data. At the initial iteration (0 iterations), the weights are distributed within the values of - 0.45 to +0.45. After optimum iterations, the magnitude of the weights dispersed significantly in the ranges of -4.5 to +6.1, as shown in Fig. 3a. Therefore, these well-distributed weights are responsible for better predictions even for a new set of input variables within the given range.
- The developed model performance was evaluated by measuring Pearson’s r and Adj. R2 values between experimental and predicted output values. The correlation coefficient for train and test data sets is nearly one for all three developed models, as shown in Fig.3c to 3d. These correlation coefficient values show that the model is capable of giving a better relationship between input and output variables.
- 3.2. Correlation of input and output variables
- In order to correlate the input-output variables, we performed a sensitivity analysis to understand the effect of sintering processing parameters on densification as well as hardness values.
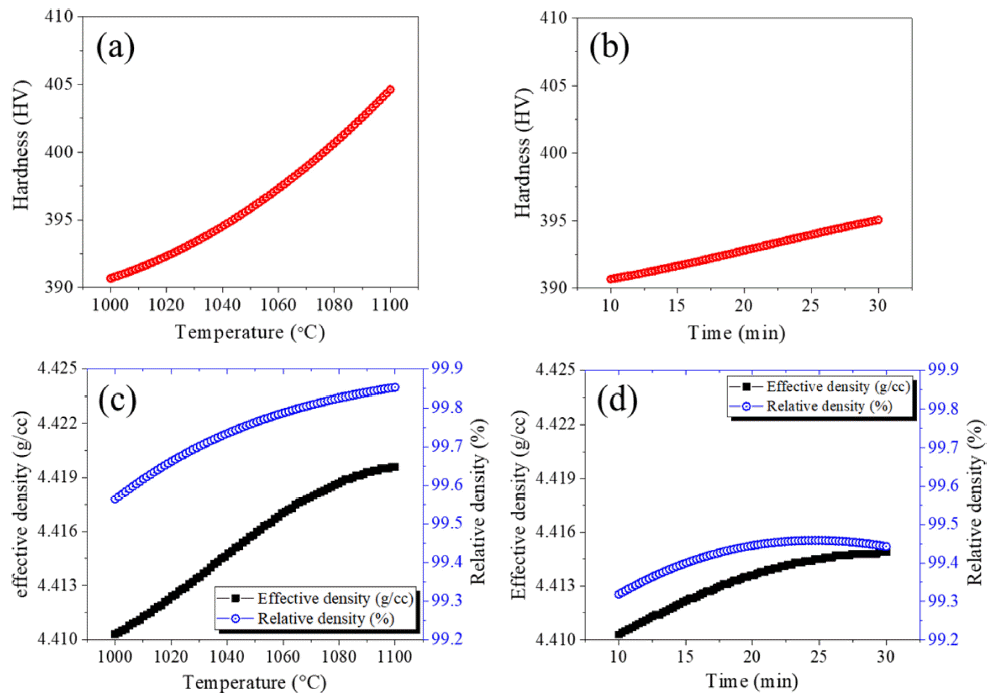
- Fig. 4 shows the effect of various input variables on output variables. The single variable line plot is very helpful in understanding the effect of individual parameters on the output parameters. Fig. 4 shows the effect of sintering condition temperature and time on density and hardness by keeping the vol.% of TiN constant (0%). The result shows that the sintering temperature and time have a significant influence on the sintered material during sintering. From Fig. 4 (a) and 4(c) it can be seen that with increasing sintering temperature, both hardness and density are increasing. At maximum sintering temperature 1100°C, 99.85% (4.42 g/cc) density was recorded with a maximum hardness value of 407 HV.
- On the other hand, the effect of sintering time on hard-ness and density was illustrated in Fig. 4 (b) and 4(d), respectively. From the figures, it is clear that the increasing time from 10 to 30 seconds slightly increases the hardness (~5 HV) and effective density (~0.005 g/cc) of the sintered product. At higher sintering temperature and relatively sufficient holding time, the diffusion of particle enhanced, resulting in higher density material [17]. Taber et al. [18] also confirmed that the increasing sintering temperature and sintering time decrease the level of porosity. Therefore, decreasing porosity helps to obtain defect-free products with high hardness and improved density.
- Fig. 5 shows the effect of the TiN fraction on the density and hardness values of Ti-6Al-4V alloy (at 1000°C and 10 min). The density decrease with vol.% TiN particle, whereas the hardness values increase with TiN addition. The decrease in density can be explained as lower temperature and time of the sintering process, which may fail to densify the material by minimizing the pores in the sintered material. On the other hand, the hardness of Ti- 6Al-4V alloy without the addition of TiN (see Table.1) shows a minimum hardness of 389HV and with an addition of 1vol.% of TiN in Ti-6Al-4V slightly increased the micro-hardness values to 430 HV. With further increase besides of TiN (4 vol.%) remarkably improved the microhardness values at the maximum extent of 480 HV. The increase of hardness could be attributed due to the uniform distribution of TiN particle in the Ti-6Al-4V matrix, and during sintering, the addition of TiN forms Ti2N hard particles [8]. So it is clear the effect of TiN nanoparticle vol.% is a higher impact on both the density and hardness values as compared that of temperature and time.
- 3.3. 3D surface plots
- As mentioned earlier, the density of the sample significantly influences by porosity. Upon high sintering temperature and time, the pores between particles are eliminated by the successive steps involved in the sintering process (neck formation, shrinkage, and grain growth). Therefore, sintering at high temperatures for longer times results in densified materials. However, in the case of hardness, the value can be considerably altered by all the input variables (temperature, time, and vol.% TiN). Therefore, the effect sintering temperature, time on the hardness of Ti-6Al-4V alloy containing various amount of TiN vol.% was predicted using the developed model, as illustrated in Fig. 6. These 3D plots are very helpful in understanding the variation of two variables and resultant output variables. The hardness values are increasing as vol.% of TiN is increasing in the Ti-6Al-4V matrix, as shown in Fig. 6 (a), (b) & (c). For instance, the hardness of pure Ti-6Al-4V (0% TiN) ranges between 395 to 400 HV within the applied sintering temperature and time conditions, as shown in Fig. 6a. With increasing TiN vol.% (1 vol.%), the hardness was increased to > 400 HV and ranged from 405 to 415 HV (see Fig. 6b). In particular, the addition of the maximum amount of TiN (4 vol.%) remarkably increases the hardness to a maximum extent of ~ 530 HV, as illustrated in Fig. 6c. As mentioned earlier, the increase in hardness with vol.% TiN is mainly due to the formation of Ti2N hard precipitates in the Ti-6Al-4V matrix [8]. From Fig. 6, the Ti-6Al-4V sintered at 1100°C and 30 min show maximum hardness value. The maximum hardness values ~ 400 HV, ~ 415 HV, and ~ 530 HV were observed in Ti-6Al-4V, Ti-6Al- 4V- 1% TiN, and 4% TiN respectively, at sintering temperature of 1100°C holding for 30 min. The higher sintering temperature and time lead toa decrease in porosity in the material, which can also help to attain the maximum hardness values in the nano-sized TiN reinforced Ti-6Al- 4V alloys.
3. Result and discussion
(a) Model weight distribution during training and correlation diagrams of experimental and ANN predicted: (b) relative density, (c) effective density, and (d) hardness.
3.2.1. Effect of sintering parameters on density and hardness
Influence of sintering (a,c) temperature (°C) and (b.d) time (min) on hardness and density of Ti-6Al-4V alloy.
3.2.2. Effect of sintering parameters on density and hardness
- Based on the present study, the following conclusions can be drawn:
• A backpropagation neural network model has been successfully developed to correlate the complicated non-linear relationship between process parameters and density and hardness of nano-sized titanium nitride reinforced in Ti-6Al-4V titanium alloy.
• The model estimated output values and experimental values are in excellent compatibility with the high value of correlation coefficients in the case of train and test datasets for all three models.
• The reported result shows that the sintering condition (temperature and time) have a slight impact on sintered density and hardness. In contrast, vol.% of TiN particles show a great impact on densification and hardness.
4. Conclusions
-
Acknowledgements
- NSR acknowledges YSJ-NVG and YKK for motivation and model development, respectively.
Acknowledgement
- 1. L. Wang, J. Zhang and W. Jiang: Int. J. Refract. Met. Hard Mater., 39 (2013) 103. .Article
- 2. L. Wang, W. Jiang, L. Chen, M. Yang and H. Zhu: J. Am. Cream. Soc., 89 (2006) 2364. .
- 3. Y. I. Lee, J. H. Lee, S. H. Hong and D. Y. Kim: Mater. Res. Bull., 38 (2003) 925. .Article
- 4. W. Liu and M. Naka: Scr. Mater., 48 (2003) 1225. .Article
- 5. L. Gao, H. Z. Wang, J. S. Hong, H. Miyamoto, K. Miyamoto, Y. Nishikawa and S. D. D. L. Torre: J. Eur. Ceram. Soc., 19 (1999) 609. .Article
- 6. Z. A. Munir, U. Anselmi-Tamburini and M. Ohyanagi: J. Mater. Sci., 41 (2006) 763. .Article
- 7. O. Guillon, J. G. Julian, B. Dargatz, T. Kessel, G. Schierning, J. Räthel and M. Herrmann: Adv. Eng. Mater., 16 (2014) 830. .Article
- 8. O. E. Falodun, B. A. Obadele, S. R. Oke, M. E. Maja and P. A. Olubambi: J. Alloys Compd., 736 (2018) 202. .Article
- 9. N. S. Reddy, B. B. Panigtahi, M. H. Choi, J. H. Kim and C. S. Lee: Comput. Mater. Sci., 107 (2015) 175. .Article
- 10. G. Xie, Q. Wang, M. Zeng and L. Luo: Appl. Therm. Eng., 27 (2007) 1096. .Article
- 11. S. C. Lee: Eng. Struct., 25 (2003) 849. .Article
- 12. N. S. Reddy, Y. H. Lee, C. H. Park and C. S. Lee: Mater. Sci. Eng. A, 492 (2008) 276. .Article
- 13. A. K. Maurya, P. L. Narayana, A. G. Bhavani and J. K. Hong: J. Electrostat., 104 (2020) 103425. .Article
- 14. N. S. Reddy, J. Krishnaiah, S. G. Hong and J. S. Lee: Mater. Sci. Eng. A, 508 (2009) 93. .Article
- 15. N. S. Reddy, J. Krishnaiah, B. Y. Hur and J. S. Lee: Comput. Mater. Sci., 101 (2015) 120. .Article
- 16. C. H. Park, D. Cha, M. Kim, N. S. Reddy and J. T. Yeom: Met. Mater. Int., 25 (2019) 768. .Article
- 17. K. M. Tsai: Int. J. Refract. Met. Hard Mater., 29 (2011) 188. .Article
- 18. T. Abdessalem, F. Schoenstein, F. Tetard and M. Abdellaoui: Int. J. Refract. Met. Hard Mater., 30 (2012) 64. .Article
Figure & Data
References
Citations

- Application of Machine Learning Algorithms and SHAP for Prediction and Feature Analysis of Tempered Martensite Hardness in Low-Alloy Steels
Junhyub Jeon, Namhyuk Seo, Seung Bae Son, Seok-Jae Lee, Minsu Jung
Metals.2021; 11(8): 1159. CrossRef

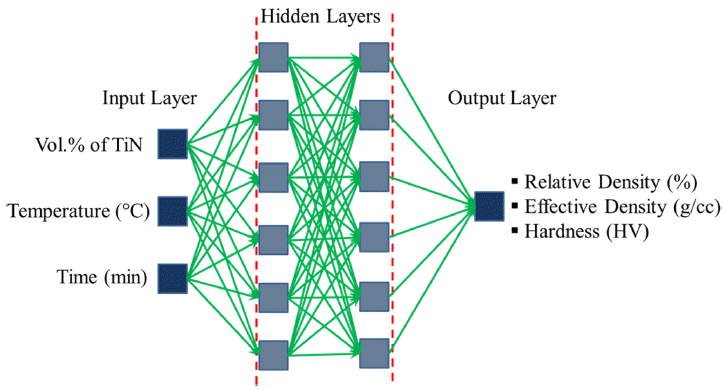


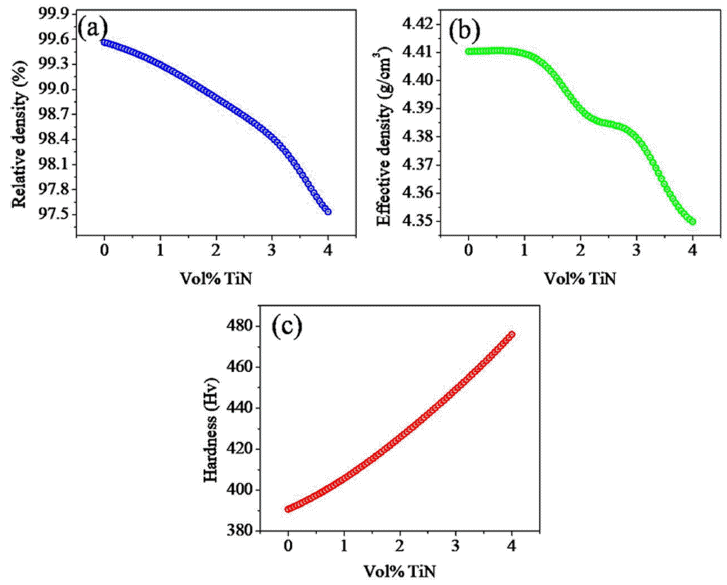
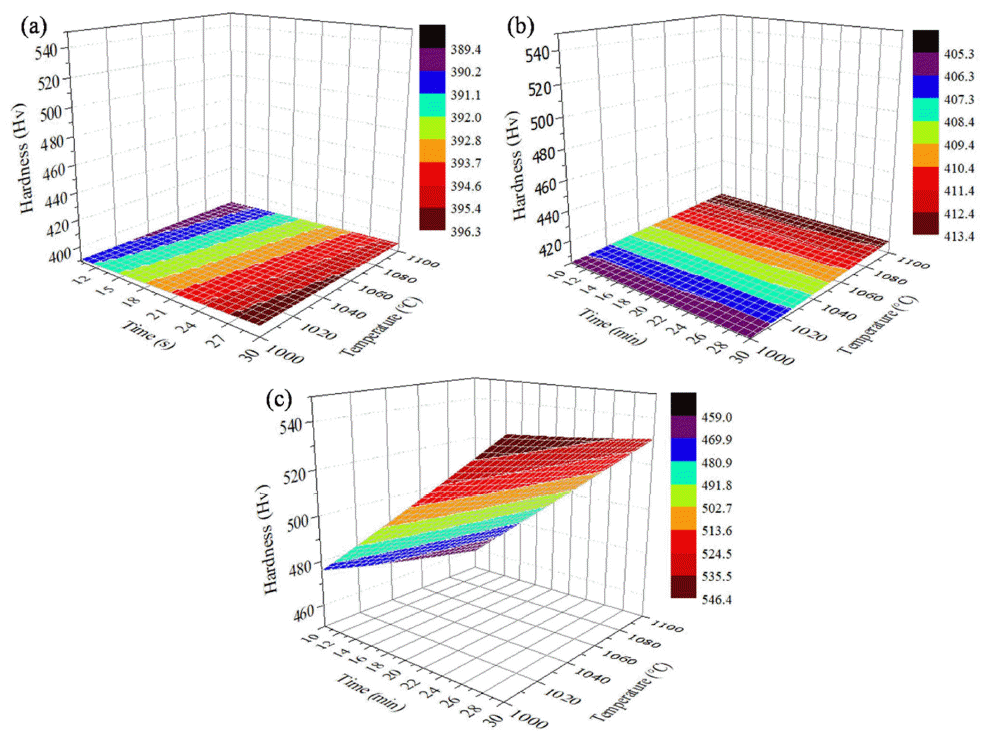
Fig. 1
Fig. 2
Fig. 3
Fig. 4
Fig. 5
Fig. 6
| TiN Vol.% | Temp. (°C) | Time (min) | Experimental | ANN predictions | ||||
|---|---|---|---|---|---|---|---|---|
|
|
||||||||
| Relative density | Effective density | Hardness (HV) | Relative density | Effective density | Hardness (HV) | |||
|
|
||||||||
| 0 | 1000 | 10 | 99.54 | 4.41 | 389 | 99.564 | 4.41 | 390.673 |
| 0 | 1000 | 30 | 99.66 | 4.415 | 395 | 99.296 | 4.415 | 395.062 |
| 0 | 1100 | 30 | 99.89 | 4.425 | 409 | 99.882 | 4.421 | 409.439 |
| 0 | 1100 | 10 | 99.77 | 4.42 | 401 | 99.852 | 4.412 | 404.614 |
| 1 | 1100 | 30 | 99.74 | 4.42 | 430 | 99.721 | 4.419 | 430.358 |
| 1 | 1100 | 10 | 99.65 | 4.41 | 426 | 99.656 | 4.41 | 424.194 |
| 1 | 1000 | 10 | 99.32 | 4.41 | 417 | 99.295 | 4.403 | 405.652 |
| 1 | 1000 | 30 | 99.09 | 4.41 | 421 | 99.092 | 4.407 | 412.943 |
| 2 | 1000 | 30 | 98.87 | 4.39 | 442 | 98.883 | 4.39 | 441.82 |
| 2 | 1100 | 10 | 99.09 | 4.4 | 453 | 99.318 | 4.407 | 460.363 |
| 2 | 1000 | 10 | 98.87 | 4.39 | 438 | 98.897 | 4.39 | 425.725 |
| 2 | 1100 | 30 | 99.43 | 4.415 | 505 | 99.443 | 4.416 | 471.884 |
| 3 | 1000 | 10 | 98.42 | 4.38 | 451 | 98.423 | 4.38 | 449.129 |
| 3 | 1100 | 30 | 99.1 | 4.41 | 544 | 99.102 | 4.41 | 543.572 |
| 3 | 1100 | 10 | 98.87 | 4.4 | 518 | 98.872 | 4.4 | 519.163 |
| 3 | 1000 | 30 | 98.65 | 4.39 | 514 | 98.645 | 4.375 | 481.942 |
| 4 | 1000 | 30 | 97.98 | 4.37 | 531 | 97.986 | 4.37 | 530.934 |
| 4 | 1000 | 10 | 97.53 | 4.35 | 475 | 97.534 | 4.377 | 475.96 |
| 4 | 1100 | 10 | 98.2 | 4.38 | 584 | 98.205 | 4.38 | 582.823 |
| 4 | 1100 | 30 | 98.89 | 4.41 | 602 | 98.641 | 4.392 | 604.899 |
| Model | Hidden layers and neurons (HL-HN1-HN2) | Iterations | Momentum term | Learning rate |
|---|---|---|---|---|
|
|
||||
| Relative density | 2 7 7 | 30000 | 0.7 | 0.8 |
| Effective density | 2 6 6 | 50000 | 0.6 | 0.6 |
| Hardness | 2 7 7 | 60000 | 0.7 | 0.6 |
Table 1
Table 2
TOP
 KPMI
KPMI


 Cite this Article


