
Articles
- Page Path
- HOME > J Powder Mater > Volume 31(3); 2024 > Article
-
Research Article
- Bandgap Tuning and Quenching Effects of In(Zn)P@ZnSe@ZnS Quantum Dots
- Sang Yeon Lee1,2, Su Hyun Park1, Gyungsu Byun2, Chang-Yeoul Kim1,*
-
Journal of Powder Materials 2024;31(3):226-235.
DOI: https://doi.org/10.4150/jpm.2024.00003
Published online: June 27, 2024
1Nano-composite Materials Center, Korea Institute of Ceramic Engineering and Technology, 101 Soho-ro Jinju-si Gyeongsangnam-do 52851, Republic of Korea
2Department of Information and Communication Eng., Inha University, 100 Inha-ro Michuho-gu, Incheon 22212, Republic of Korea
- *Corresponding author: Chang-Yeoul Kim, TEL: +82-55-792-2707, FAX: +82-55-792-2730, E-mail: cykim15@kicet.re.kr
© The Korean Powder Metallurgy & Materials Institute
This is an Open Access article distributed under the terms of the Creative Commons Attribution Non-Commercial License (http://creativecommons.org/licenses/by-nc/4.0/) which permits unrestricted non-commercial use, distribution, and reproduction in any medium, provided the original work is properly cited.
- 3,991 Views
- 47 Download
- 1 Crossref
Abstract
- InP quantum dots (QDs) have attracted researchers’ interest due to their applicability in quantum dot light-emitting displays (QLED) or biomarkers for detecting cancers or viruses. The surface or interface control of InP QD core/shell has substantially increased quantum efficiency, with a quantum yield of 100% reached by introducing HF to inhibit oxide generation. In this study, we focused on the control of bandgap energy of quantum dots by changing the Zn/(In+Zn) ratio in the In(Zn)P core. Zinc incorporation can change the photoluminescent light colors of green, yellow, orange, and red. Diluting a solution of as-synthesized QDs by more than 100 times did not show any quenching effects by the Förster resonance energy transfer phenomenon between neighboring QDs.
- Recently, semiconducting quantum dots (QDs) have attracted many attentions for their various applications to light-emitting displays (LED) and biomarkers for the detection of cancers or viruses, since QDs of CuCl2 and CdS was firstly synthesized [1, 2]. The bandgap energies of QDs could be controlled by changing the crystal sizes, then photoluminescent light color can be varied from blue to red due to their quantum confinements. The most widely studied QD material is CdSe for its stability and high quantum efficiency (QE), the rate of light emission versus incident photon. However, cadmium is a prohibited material for its toxicity. So, these days, InP QDs have been intensively researched. The InP QDs with highest QE of 100% was reported to develop QD LED by the inhibition of oxide generation on the surface of QDs with HF [3]. To improve the optical properties like QE, narrow band of PL light (smaller full-width at half maximum; FWHM), stability and the control of light color, many researches have been conducted [4-22]. It is known that the control of InP QD surfaces and InP core/shell interface is important [3, 6, 21, 22]. The adoption of halide precursor of indium is known to control the bandgap energies of InP QDs with the emission of blue, green and red color [23, 24]. Zn doping into InP QDs is known to be a good method to control the bandgap energy and improve the QE. The control of Zn/In ratio could change the P L(photoluminescence) peak wavelength and UV-Vis. absorption wavelength. N. Kirkwood et al [25] demonstrated that most of zinc atoms exist on the surface of InP QDs and only a small amount of zinc infiltrated into the lattice and contract the lattice parameter. In this study, we also change the ratio of In/(In+Zn) to investigate the effects of zinc incorporation for the InP QD core formation with the same composition of ZnSe and ZnS shell formation. We will also discuss the PL quenching effects of In(Zn)P@ZnSe@ZnS QDs concentrations by FRET (Förster resonance energy transfer) phenomenon.
1. Introduction
- 2.1. Chemicals
- For the synthesis of In(Zn)P QD cores, indium(III) acetate (In(Ac)3, 99.99 %, Sigma Aldrich, USA) and zinc acetate (Zn(Ac)2, 99.99 %, Sigma Aldrich, USA) were purchase from Sigma Aldrich and trioctylamine was purchased from Daejung Chemical. (TOA, 99 %, Daejung, Korea) The source of phosphine was tris(trimethylsilyl)phosphine. (ca. 10 % in Hexane, (TMS)3P; TCI Tokyo, Japan)
- The capping agent for QDs was oleic acid (OA, 90 %, Sigma Aldrich, USA) and lauric acid (LA, 98%,Sigma Aldrich, USA) and palmitic acid. (LA, 98%,Sigma Aldrich, USA) For the formation of shell, ZnSe, selenium (Se, 99.99 %, Sigma Aldrich) and trioctylphosphine (TOP, 90 %, Sigma Aldrich) were purchased from Sigma Aldrich. For ZnS shell, sulfur (S, 99.98 %, Sigma Aldrich) was used. The organic solvents for the dispersion of QDs were 1-octadecene (ODE, 90 %, Sigma Aldrich, USA) and toluene (99.8 %, Sigma Aldrich), hexane (95 %, Sigma Aldrich) and chloroform (99 %, Duksan chemical, Korea). For the purification, acetone (99.8 %, Daejung) and methyl alcohol (99.5 %, Daejung) were used.
- 2.2. Synthesis of In(Zn)P@ZnSe@ZnS QDs
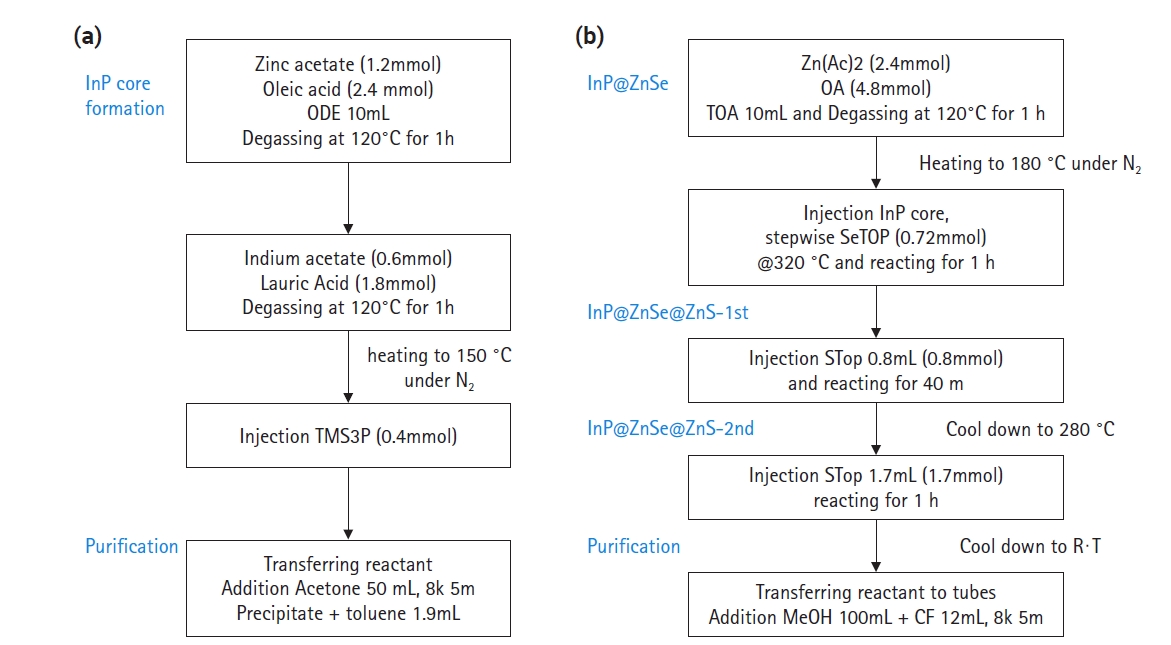
- The precursor chemicals of In(Zn)P cores were In(Ac)3, (TMS)3P, Zn(Ac)2. In a 100 mL 3-neck flask, 1.2 mmol of Zn(Ac)2 was dissolved in 2.4 mmol of OA and 10mL of ODE and degassed at 120 ℃ for 1 h (~500 mTorr). The reactant solution was observed to be clear. It was cooled to R∙T under N2 and then 0.6 mmol of In(Ac)3 and 1.8mmol of LA were added. In this experiment, we varied In/(In+Zn) ratio from 0.33 to 1 by changing Zn(Ac)2 to In(Ac)3 molar ratio as shown in table 1. The reactant was degassed at 120 ℃ for 1 h again (~500 mTorr). After that, 0.4mmol (TMS)3P precursor that was dissolved in 10 mL TOP was injected after heating up to 150 ℃ under N2. The temperature was heated to 240℃ and the heating mantle was removed to cool down to below 100 ℃, rapidly. The reactant was transferred into two 50 mL conical tubes and 25 mL of acetone was added into each tube for purification. The reactant solution was centrifuged at 9,000 rpm for 5 m and the supernatant was discarded and the precipitate was taken and 25 mL of acetone was added and centrifuged at 9,000 rpm for 5 m. The purification was performed three times. Finally, the precipitate of In(Zn)P QD core was suspended in 2 mL toluene.
- The inner shell of In(Zn)P@ZnSe QDs was formed from Zn(Ac)2 and SeTOP, which was synthesized by dissolving Se in TOP specified below. 2.4 mmol of Zn(Ac)2 in 4.8 mmol of OA and 10mL TOA were dissolved and degassed at 120 ℃ for 1 h (~500 mTorr). The reaction temperature was raised to 180 °C under N2, 2 mL of In(Zn)P cores synthesized previously were injected into the reaction solution and 0.72 mmol of SeTOP (in 10mL) TOP was added dropwise while raising the temperature to 320 °C and reacted for 1 h. Then, for the formation of the first outer shell of ZnS, that is, the final formation of In(Zn)P@ZnSe@ZnS core/shell, 0.8 mmol of STOP (in 10mL) were injected and reacted at 320 °C for 1h. For the formation of the second outer shell of ZnS, the reactant was cooled down to 280 ℃, and 1.7 mmol of STOP (in 10mL) was injected into the reaction solution and reacted at 280 °C for 40 m. The reactant was cooled down to R∙T and centrifuged by chloroform and methanol. The experimental procedure for the synthesis of In(Zn)P@ZnSe@ZnS was shown in Fig. 1.
- 2.3. Characterization
- UV−Vis Absorption Spectroscopy and PL emission spectra
- Steady-state absorption spectra of the QD samples diluted by 1 to 3,200 times were recorded by using a UV/vis spectrometer (V670, Jasco, Japan). Steady-state PL of QDs in toluene was measured by using a fluorescence spectrophotometer (HR4000, Ocean Optics, USA) excited by 425 nm blue LED light. The sample preparation of the QDs for the transmission electron microscopy (TEM) observation was conducted by putting the solution-based QDs on carbon-coated copper grid and drying. The TEM observation was conducted by 400kV-high resolution TEM (JEOL-JEM-4010).
2. Experiment
2.2.1 The synthesis of In(Zn)P core
2.2.2 The synthesis of In(Zn)P@ZnSe@ZnS core/shell
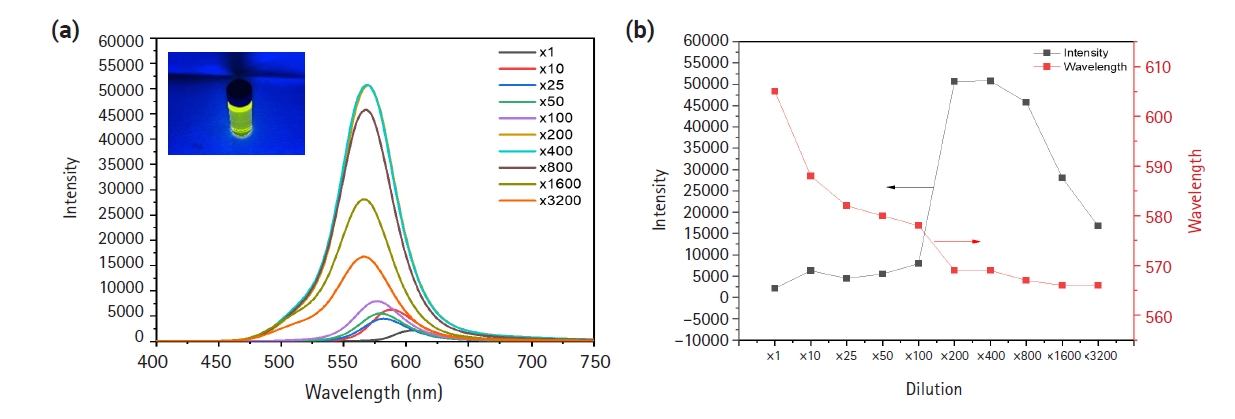
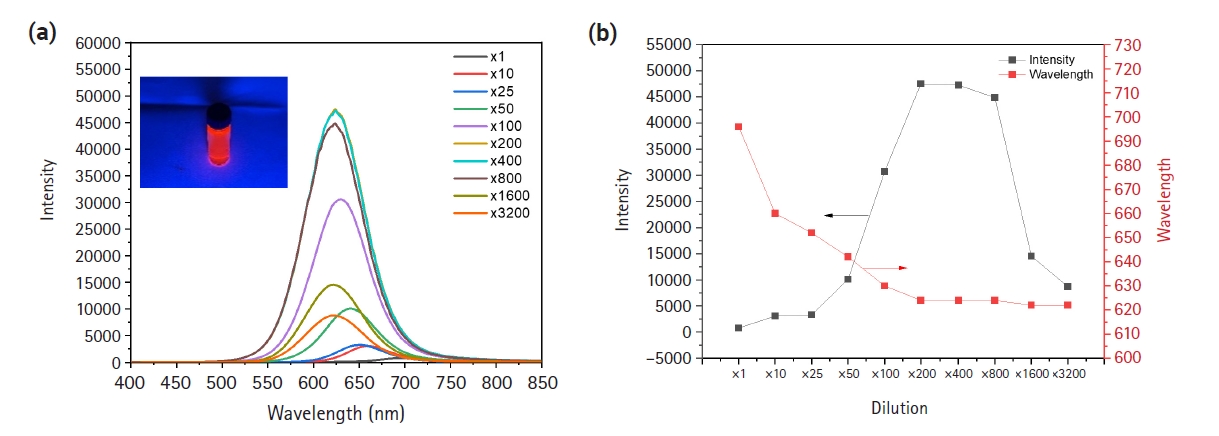
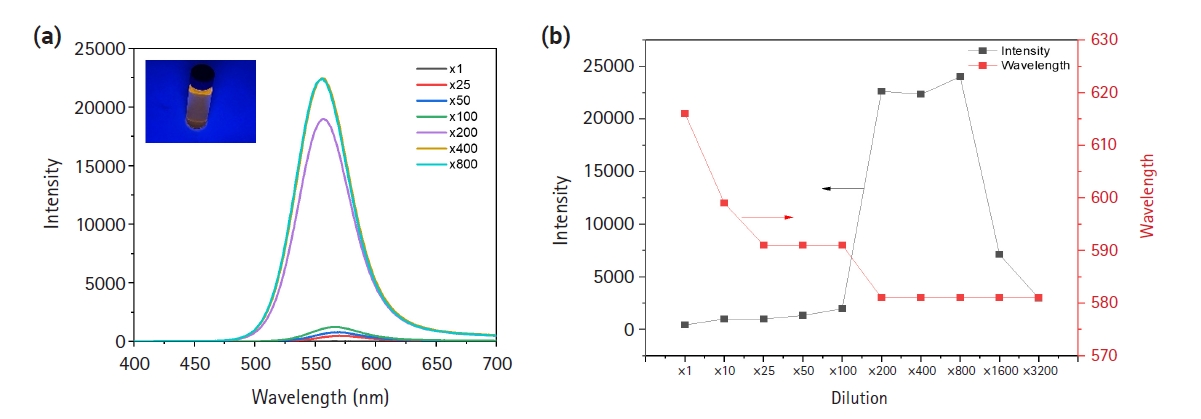
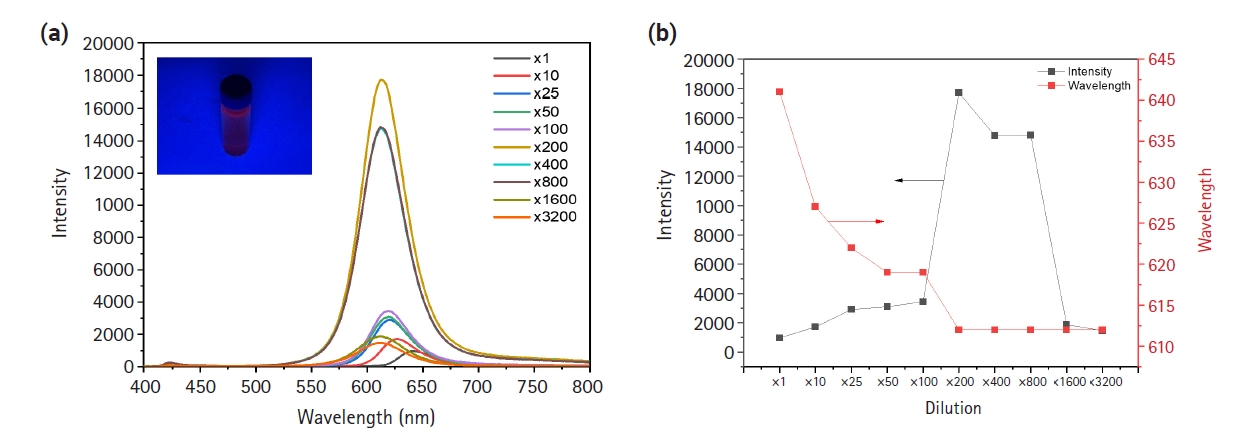
- Photoluminescence spectra of In(Zn)P@ZnSe@ZnS with 0.33 of In/(In+Zn) was shown in Fig. 2(a). The synthesized QDs showed the low PL peak intensity less than 10,000 cps. However, the dilution up to 25 times the intensity increase is slow and it increased very largely up to 50,000 cps for 100 times of dilution and saturated up to 800 times and then began to decrease up to 17,000 cps for 3,200 times of dilution. The wavelength of the emitted light of QDs with no dilution was 590 nm and decreased to 553 nm for 100 times of dilution and then did not show any change. As shown in Fig 2 (a), the light color of the sample was green. When the contents of In/(In+Zn) was 0.5, that is, 1;1 molar ratio of In to Zn, as shown in Fig. 3. the PL intensity increased very small up to 50 times of dilution, and then increased very largely up to 50,000 cps for 100 and 200 times of dilution. After that, it decreased to 15,000 cps for 3,200 times of dilution. The wavelength of the samples decreased from 605 nm for no dilution to 566 nm for 3,200 times of dilution. The light color of the sample with 200 times of dilution was greenish yellow color, equivalent to the wavelength of 560 nm. The increase of indium contents to 0.67 of In/(In+Zn) ratio increased the emission light wavelength to 605 nm for 200 times of diluted sample. The light color under 420 nm UV light illumination was red as shown in Fig. 4. The PL intensity variations with dilution quantities showed the almost sample trend. There is a small increase of PL intensity for 25 times of dilution and then increased greatly up to 200 times of dilution and began to decrease for more than 800 times of dilution. As shown in Fig. 5, the more increase of indium ratio to 0.8 decreased the wavelength of emitted light to 580 nm, yellow light. The PL intensity increased slightly to 2,500 cps for 100 times of dilution and then increase greatly for 200 to 1,600 times of dilution and began to decrease for greater than 1,600 times of dilution. The PL spectra of In(Zn)P@ZnSe@ZnS with 1 of In/(In+Zn) was shown in Fig. 6. This QD sample without zinc showed the red-light emission with 613 nm of wavelength. The emitted light wavelength without dilution was 640 nm and decreased gradually to 613 nm for more than 200 times of dilution.
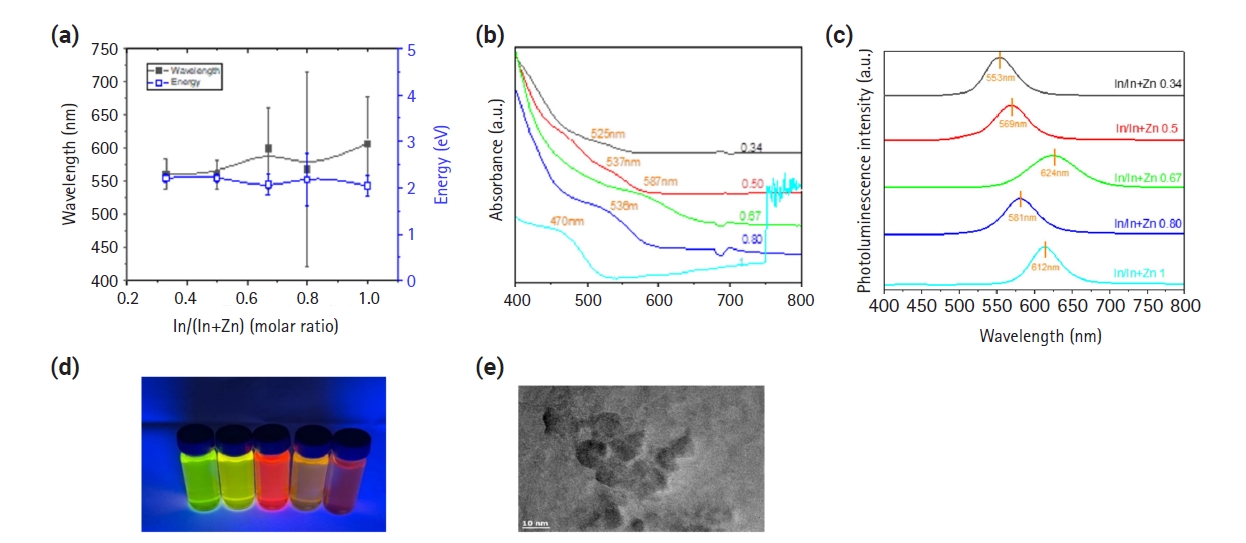
- The absorbance spectra of the QDs with different In/(In+Zn) ratio diluted at 200 times and their corresponding PL spectra were shown in Fig 7 (a) and (b), and the photographs of QDs with 0.33, 0.5, 0.67, 0.8 and 1 of In/(In+Zn) ratio under 420 nm of UV illumination were shown in Fig. 7 (c). The absorbance peak appeared at 523 nm for 0.33 ratio, 573 nm for 0.5, 587 nm for 0.67, 536 nm for 0.8 and 470 nm for 1 In/(In+Zn) ratio. The corresponding PL emission peaks were 553, 569, 624, 581, and 612 nm, respectively. The colors of the QDs were green, yellow, red, orange, and dark red, respectively. First absorption peak wavelengths, absorbances, band edge energy (EQD), volume of QDs (VQD), molar extinction coefficients (ε), and molar concentrations (C) of QD samples were summarized in table 2. As In/(In+Zn) ratio less than 0.67, the QDs showed the green or yellow colors at PL peak range between 550-570 nm, and their absorbance peaks increased from 535 nm for 0.33 ratio to 587 nm for 0.67nm. For more than 0.67 ratio, PL peaks showed red color with more than 600 nm (except 581 nm for 0.8 of the ratio) and their absorbance peak decreased from 587 nm to 470 nm. (Fig. 7 (c)) As mentioned in the introduction section, Kirkwood et al [25] specifically studied of Zn location in InP QD and structural and optical properties of In(Zn)P QDs by Zn incorporation ratio. We summerized PL properties of QDs in table 3.
- We observed the TEM images of the QDs for 0.33 of the ratio (Zn : In = 2:1) to find out the QD crystal size about 10 nm with an almost spherical shape (Fig. 7 (d) and Fig. 8).
3. Results
- 4.1. Size and volume of QDs
- We can calculate the size of QD nanocrystals by using the following formula [26].
- where LQD is the average nanocrystal edge length, EQD is the energy of band edge transition, Eb is the bulk band gap of InP (1.35 eV), and C and α are empirically derived fitting parameters (4.25 and 0.96, respectively for a tetrahedral-shaped InP QD nanocrystal). We need to obtain the average volume (VQD) of a single QD crystal by using the following formula.
- As shown in table 2, the QD crystal sizes were 7.30 nm for 0.33 of In/(In+Zn) ratio, 6.75 nm for 0.5, and the largest value of 11.14 nm for 0.67 of the ratio, and decreased to 6.85 nm for 0.8 and 4.3 nm for 1. The QD crystal size for 0.33 by TEM observation is about 10 nm, which is a little greater than the calculated size of 7.3 nm. However, the calculated QD crystal size is considered to be 8.65 ± 1.35 nm (standard error) (Fig. 8).
- 4.2. Absorptivity (ε1s) and molar concentration of QDs
- The concentration of InP@ZnSe@ZnS QDs is determined by the absorbance of UV−Vis spectroscopy. The intrinsic absorption coefficient of a QD material, μi, is size-independent at sufficiently short wavelengths. The absorbance (A) of QDs can be expressed as the Beer-Lambert equation, A=εcl, where ε is a molar attenuation (or extinction) coefficient (M-1cm-1), c is a molar concentration (M) of QDs, and l is an optical path length of cuvette (in meter scale). The absorbance of A is also expressed as A=ln I0/I, where I0 is an intensity of incident light and I is that of transmitted light. The absorbance can be shown as
- Comparing to Beer-Lambert’s law, the molar extinction coefficient, ε, from this intrinsic absorption coefficient is expressed as following equation.
- where NA is the Avogadro number, VQD is the average volume of the In(Zn)P@ZnSe@ZnS QDs, and μi,InP is 8.5 × 104 cm−1 at 413 nm and μi,ZnSe is the intrinsic absorption coefficient of InP at 413 nm. We adopted 5.0 × 104 cm−1 (theoretical value) of μi,ZnSe at 420 nm. fInP and fZnSe is volume fractions of InP and ZnSe of core/shell components of QDs, where the values fInP and fZnSe were adopted as 0.037 and 0.963, respectively in the reference [4]. The molar extinction coefficient of QDs were in the range of 2.25~9.70 × 10⁶ M-1cm−1 and the molar concentration were between 20 and 137 nM. The concentrations were of the diluted QDs by 200 times, and so the as-synthesized molar concentration was calculated to be between 4-27 μM.
- 4.3. Förster Resonance Energy Transfer (FRET) effects of QDs
- Fluorescence resonance energy transfer (originally Förster resonance energy transfer; FRET) is energy transfer from donor to acceptor, In(Zn)P@ZnSe@ZnS QDs fluorophore and oleic acid in this paper. The FRET efficiency (E) depends on many physical parameters such as (1) the distance between the donor and the acceptor, (2) the spectral overlap of the donor emission spectrum, and (3) the relative orientation of the donor emission dipole moment. In this study, the acceptor of oleic acid is not a fluorophore and so it plays only as an energy transfer path from the donor the QDs to lipid organics. The rate of energy transfer (kET) can be expressed like the following equation.
- where QD is the fluorescence quantum yield of the donor in the absence of the acceptor, k2 is the dipole orientation factor, n is the refractive index of the medium, NA is the Avogadro constant, ϵA (λ) is the acceptor molar extinction coefficient, and J(ν) is the spectral overlap integral calculated as
4. Discussion
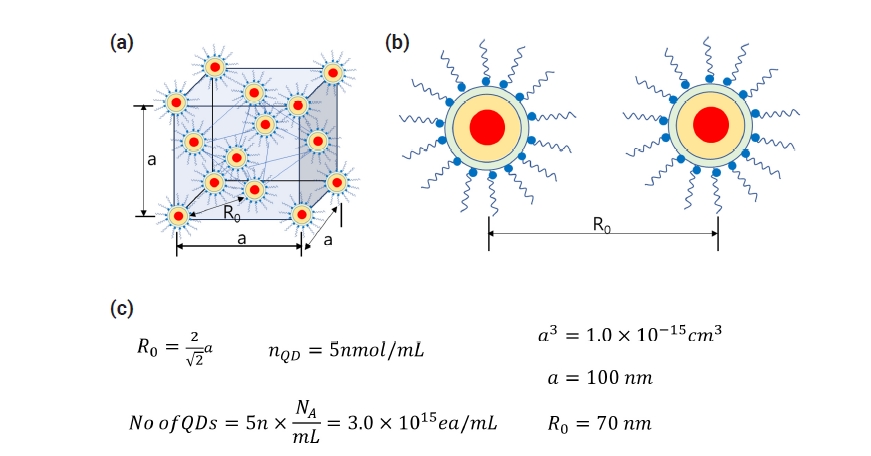
- In our study, we discussed effects of the ratio of In/(In+Zn) to the PL and UV-Vis. absorption properties of In(Zn)P@ZnSe@ZnS QDs. The PL light of the QDs with the ratio of more than 2/3 indium is red color and the PL lights of the QDs with less than 2/3 of In ratio show green and yellow colors. The brightest red PL properties of the QDs ca be obtained for 2/3 ratio of In/(In+Zn) with the largest crystal size. The FRET quenching effects of the QDs suppress the PL intensities with less than R0, 70 nm calculated FRET equation. The dilution of QDs solution by more than 100 times with about 50 nmol/mL does not show FRET phenomenon with the distance of 7 μm between the neighboring QDs.
5. Conclusions
-
Conflict of Interest Declaration
The authors declare no competing financial interests or personal relationships.
-
Author Information
S. Y Lee: Student, S. H. Park: Researcher, G. Byun: Professor, C.-Y. Kim: Principal Researcher
-
Acknowledgement
The authors are appreciated for the financial support by the project of nano-material development of Korean national research foundation (NRF-2021M3H4A6A03103774) and the strategic material development program of Korea Institute of Ceramic Engineering and Technology (KPP21003).
Article information


- 1. A. I. Ekimov and A.A. Onushchenko: Jetp Lett., 34 (1981) 345.
- 2. R. Rossetti and L. Brus: J. Phys. Chem., 86 (1982) 4470.Article
- 3. Y. Won, O. Cho, T. Kim, D.-Y. Chung, T. Kim, H. Chung, H. Jang, J. Lee, D. Kim and E. Jang: Nature., 575 (2019) 638.
- 4. Y. Kim, S. Ham, H. Jang, J. Min, H. Chung, J. Lee, D. Kim and E. Jang: ACS Appl. Nano Mater., 2 (2019) 1496.Article
- 5. R. Xie, D. Battaglia and X. Peng: J. Am. Chem. Soc., 129 (2007) 15432.Article
- 6. J. Ziegler, S. Xu, E. Kucur, F. Meister, M. Batentschuk, F. Gindele and T. Nann: Adv. Mater., 20 (2008) 4068.Article
- 7. E. Jang, S. Jun, H. Jang, J. Lim, B. Kim and Y. Kim: Adv. Mater., 22 (2010) 3076.Article
- 8. S. Tamang, C. Lincheneau, Y. Hermans, S. Jeong and P. Reiss: Chem. Mater., 28 (2016) 2491.Article
- 9. P. Ramasamy, N. Kim, Y. Kang, O. Ramirez and J. Lee: Chem. Mater., 29 (2017) 6893.
- 10. Q. Wu, F. Cao, S. Wang, Y. Wang, Z. Sun, J. Feng, Y. Liu, L. Wang, Q. Cao, Y. Li, B. Wei, W. Wong and X. Yang: Adv. Sci., 9 (2022) 2200959.
- 11. L. Qian, Y. Zheng, J. Xue and P. Holloway: Nat. Photon., 5 (2011) 543.ArticlePDF
- 12. B. S. Mashford, M. Stevenson, Z. Popovic, C. Hamilton, Z. Zhou, C. Breen, J. Steckel, V. Bulovic, M. Bawendi, S. C. Sullivan and P. T. Kazlas: Nat. Photon., 7 (2013) 407.ArticlePDF
- 13. Z. Zhang, Y. Jin, Y. Niu, H. Cao, X. Liang, L. Chen, J. Wang and X Peng: Nature., 515 (2014) 96.ArticlePDF
- 14. J. R. Manders, L. Qian, A. Titov, J. Hyvonen, J. T. Scott, K. P. Acharya, Y. Yang, W. Cao, Y. Zheng, J. Xue and P. H. Holloway: J. Soc. Inf. Disp., 23 (2015) 523–528.ArticlePDF
- 15. J. Lin, Y. Hu, X. Guo, Y. Lv, Z. Tang, J. Zhao, Y. Fan, N. Zhang, Y. Wang and X. Liu: ACS Appl. Mater. Interfaces., 9 (2017) 38755.
- 16. W. K. Bae, Y.-S. Park, J. Lim, D. Lee, L. A. Padilha, H. McDaniel, I. Robel, C. Lee, J. M. Pietryga and V. I. Klimov: Nat. Commun., 4 (2013) 2661.
- 17. Y. Yang, Y. Zheng, W. Cao, A. Titov, J. Hyvonen, J. R. Manders, J. Xue, P. H. Holloway and L. Qian: Nat. Photon., 9 (2015) 259.ArticlePDF
- 18. W. Cao, C. Xiang, Y. Yang, Q. Chen, L. Chen, X. Yan and L. Qian: Nat. Commun., 9 (2018) 2608.
- 19. Y. Li, X. Hou, X. Dai, Z. Yao, L. Lv, Y. Jin and X. Peng: J. Am. Chem. Soc., 141 (2019) 6448.Article
- 20. P. Reiss, M. Carriere, C. Lincheneau, L. Vaure and S. Tamang: Chem. Rev., 116 (2016) 10731.Article
- 21. O. I. Mićić, K. M. Jones, A. Cahill and A. J. Nozik: J. Phys. Chem. B., 102 (1998) 9791.Article
- 22. J. L. Stein, W. M. Holden, A. Venkatesh, M. E. Mundy, A. J. Rossini, G. T. Seidler and B. M. Cossairt: Chem. Mater., 30 (2018) 6377.Article
- 23. M. D. Tessier, E. A. Baquero, D. Dupont, V. Grigel, E. Bladt, S. Bals, Y. Coppel, Z. Hens, C. Nayral and F. Delpech: Chem. Mater., 30 (2018) 6877.Article
- 24. M. D. Tessier, D. Dupong, K. D, J. D. Roo and Z Hens: Chem. Mater., 27 (2015) 4893.Article
- 25. N. Kirkwood, A. De Backer, T. Altantzis, N. Winckelmans, A. Longo, F.V. Antolinez, F. T. Rabouw, L.De Trizio, J. J. Geuchies, J. T. Mulder, N. Renaud, S. Bals, L. Manna and A. J. Houtepen: Chem. Mater., 32 (2020) 557.ArticlePDF
- 26. M. Parvizian, J. Bechter, J. Huber, N. Chettata and J. De Roo: J. Chem. Educ., 100 (2023) 1613.ArticlePDF
- 27. G. Beane, K. Boldt, N. Kirkwood and P. Mulvaney: J. Phys. Chem. C., 118 (2014) 18079.Article
References
Figure & Data
References
Citations
- Enhancing luminescence of QD thin films, polymer composite films, and LED devices by nanostructures
Hongcheng Yang, Junjie Hao, Mingyu Sun, Yujie Song, Kai Wang, Yujie Song, Xiao Wei Sun, Wenda Zhang
The Innovation.2026; 7(2): 101121. CrossRef
 ePub Link
 Cite this Article
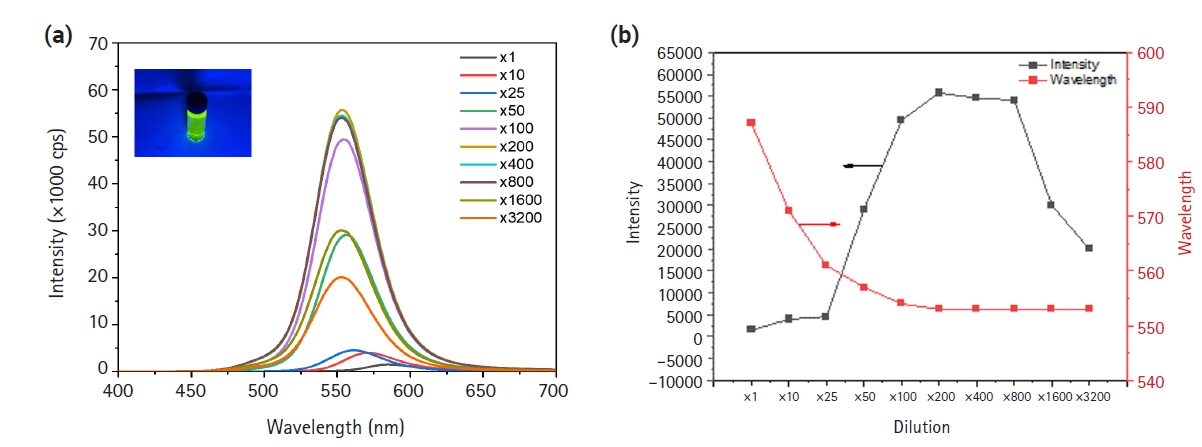


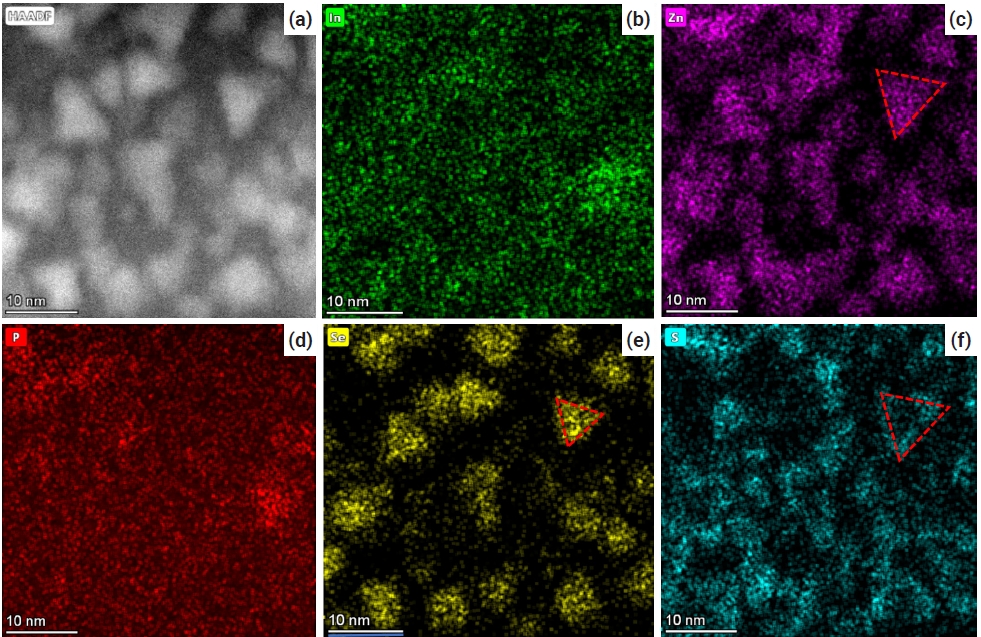


Fig. 1.
Fig. 2.
Fig. 3.
Fig. 4.
Fig. 5.
Fig. 6.
Fig. 7.
Fig. 8.
Fig. 9.
| Samples | In(Zn)P core |
ZnSe shell |
ZnS shell |
||||||
|---|---|---|---|---|---|---|---|---|---|
| In | Zn | In/(In+Zn) | In & Zn (mmol) | TMS3P (mmol) | Zn (mmol) | SeTOP (mmol) | STOP (mmol) | STOP (mmmol) | |
| #1 | 1 | 2 | 0.33 | 1.8 | 0.4 | 2.4 | 0.72 | 0.8 | 1.7 |
| #2 | 1 | 1 | 0.50 | 1.8 | 0.4 | 2.4 | 0.72 | 0.8 | 1.7 |
| #3 | 2 | 1 | 0.67 | 1.8 | 0.4 | 2.4 | 0.72 | 0.8 | 1.7 |
| #4 | 4 | 1 | 0.80 | 1.8 | 0.4 | 2.4 | 0.72 | 0.8 | 1.7 |
| #5 | 1 | 0 | 1.0 | 1.8 | 0.4 | 2.4 | 0.72 | 0.8 | 1.7 |
| Samples | In/(In+Zn) | Wavelength (1st peak) /nm | Absorbance | EQD |
LQD |
VQD |
ε |
C |
|---|---|---|---|---|---|---|---|---|
| eV | nm | nm3 | x106M-1cm-1 | x10-9M | ||||
| #1 | 0.33 | 525 | 0.1857 | 1.98 | 7.30 | 203.7 | 2.732 | 67.9 |
| #2 | 0.5 | 536 | 0.0926 | 2.03 | 6.75 | 161.0 | 2.160 | 42.9 |
| #3 | 0.67 | 586 | 0.2097 | 1.77 | 11.14 | 723.9 | 9.710 | 21.6 |
| #4 | 0.8 | 535 | 0.3101 | 2.02 | 6.85 | 168.3 | 2.257 | 137 |
| #5 | 1.0 | 470 | 1.15844 | 0.36 | 4.3 | 41.5 | 556,424 | 2,081 |
| Samples | In/(In+Zn) |
PL peak |
Intensity |
FWHM |
Absorbance |
|---|---|---|---|---|---|
| Molar ratio | nm | cps | nm | ||
| #1 | 0.33 | 553 | 55,751 | 43 | 0.1857 |
| 571 | 36,179 | 45 | |||
| 559 | 57,611 | 44 | |||
| Mean (95%, k=2) | 561±23 | 49,847±29,494 | 44±2.5 | ||
| #2 | 0.5 | 569 | 50,782 | 52 | 0.0926 |
| 560 | 13,441 | 42 | |||
| 551 | 28,507 | 49 | |||
| Mean (95%, k=2) | 560±22 | 30,910±46,667 | 48±13 | ||
| #3 | 0.67 | 574 | 19,663 | 41 | 0.2097 |
| 600 | 54,083 | 56 | |||
| 624 | 47,526 | 66 | |||
| Mean (95%, k=2) | 599±62 | 40,424±45,400 | 54±31 | ||
| #4 | 0.8 | 556 | 22,435 | 53 | 0.3101 |
| 579 | 22,402 | 49 | |||
| Mean (95%, k=2) | 568±146 | 22,418±210 | 51±25 | ||
| #5 | 1.0 | 612 | 17,704 | 43 | 1.15844 |
| 601 | 15,998 | 47 | |||
| Mean (95%, k=2) | 607±70 | 16,851±10,838 | 45±25 |
QD, quantum dot.
QD, quantum dot.
Table 1.
Table 2.
Table 3.
TOP
