Articles
- Page Path
- HOME > J Powder Mater > Volume 29(6); 2022 > Article
-
Article
- Optimization of VIGA Process Parameters for Power Characteristics of Fe-Si-Al-P Soft Magnetic Alloy using Machine Learning
- Sung-Min Kima,b, Eun-Ji Chaa, Do-Hun Kwona,b, Sung-Uk Hongc, Leea,d, Seok-Jae Leee, Kee-Ahn Leeb, Hwi-Jun Kima,*
-
Journal of Korean Powder Metallurgy Institute 2022;29(6):459-467.
DOI: https://doi.org/10.4150/KPMI.2022.29.6.459
Published online: November 30, 2022
a Smart liquid processing R&D department, Korea institute of Industrial Technology, Incheon 21999, Republic of Korea
b Department of Materials Science and Engineering, Inha University, Incheon 22201, Republic of Korea
c Manufacture of powder materials, Metal Mate, Incheon 22531, Republic of Korea
d Department of Advanced Materials Engineering, Kookmin University, Seoul 02707, Republic of Korea
e Division of Advanced Materials Engineering, Jeonbuk National University, Jeonju 54896, Republic of Korea
- * Corresponding Author: Hwi-Jun Kim, TEL: +82-32-850-0406, FAX: +82-32-850-0390, E-mail: khj@kitech.re.kr
- - 김성민·권도훈·이연주: 학생, 차은지: 연구원, 홍성욱: 대표, 이석재·이기안: 교수, 김휘준: 수석연구원
© The Korean Powder Metallurgy Institute. All rights reserved.
- 675 Views
- 12 Download
Abstract
- Soft magnetic powder materials are used throughout industries such as motors and power converters. When manufacturing Fe-based soft magnetic composites, the size and shape of the soft magnetic powder and the microstructure in the powder are closely related to the magnetic properties. In this study, Fe-Si-Al-P alloy powders were manufactured using various manufacturing process parameter sets, and the process parameters of the vacuum induction melt gas atomization process were set as melt temperature, atomization gas pressure, and gas flow rate. Process variable data that records are converted into 6 types of data for each powder recovery section. Process variable data that recorded minute changes were converted into 6 types of data and used as input variables. As output variables, a total of 6 types were designated by measuring the particle size, flowability, apparent density, and sphericity of the manufactured powders according to the process variable conditions. The sensitivity of the input and output variables was analyzed through the Pearson correlation coefficient, and a total of 6 powder characteristics were analyzed by artificial neural network model. The prediction results were compared with the results through linear regression analysis and response surface methodology, respectively.
- As problems such as global warming are becoming serious around the world, research and technology development to increase the efficiency of motors used in electric vehicles and home appliances to save energy has become an issue, and research to improve the characteristics of magnetic materials is being actively conducted [1- 4]. There is an urgent need for high-performance and high-efficiency Fe-based soft magnetic powder materials with high magnetic flux density/low loss and commercialization technology to meet these requirements. In power converters of various shapes and sizes required in the electric vehicle industry, soft magnetic cores must meet high efficiency and economic feasibility [2, 3]. In order to improve the characteristics and productivity of high-density soft magnetic cores, predicting and verifying the effects of factors on the characteristics of soft magnetic powders and material design process technology are urgently required [5-7]. Manufacturing process of soft magnetic powders influences the characteristics of the powder through varying gas atomization process conditions. The process of manufacturing soft magnetic cores for power conversion devices consists of manufacturing soft magnetic powder, powder heat treatment, powder compounding, powder molding, heat treatment, and characteristic evaluation in the order [7, 8]. Artificial intelligence has been used in the field of material design. Although it was possible to understand the characteristics or microstructure of existing materials, it was difficult to quantitatively analyze them. Currently, various researches have been conducted to discover correlations through artificial intelligence to predict theoretical analysis and physical properties of materials, and even reverse engineering [9, 10]. In a recent study, the manufacturing process was optimized through machine learning for nickel cobalt powder in the EIGA (Electrode Induction Melting Gas Atomization) process. By predicting the optimal atomization temperature and pressure, the recovery rate of D50 is 77.85% [7]. However, there has been little optimization attempt to predict and experimentally verify the effect of VIGA (Vacuum Induction melt Gas Atomization) processes on the characteristics of soft magnetic powder through an optimization model. However, by using the VIGA process to equip the orifice, the Fe- Si-Al-P soft magnetic alloy powder was differentiated by optimizing the flowability, apparent density, and aspect ratio as well as the effect of manufacturing variables and particle size.
- In this study, effects of the average and standard deviation of atomization temperature, atomization gas pressure, and atomization gas flow rate on the characteristics of Fe-Si-Al-P soft magnetic alloy powder such as particle size distributions, apparent density, flowability and aspect ratio were investigated. The effects of VIGA process factors were optimized by applying linear regression analysis, response surface analysis, and artificial neural network through machine learning. In the case of the artificial neural network model, since the regression method was approached, the accuracy of learning was not immediately calculated on the program, so the absolute error value RMS (Root Mean Square) between the experimental value and the predicted value was obtained and used. The experimental results of D10, D50, and D90 were used as targets.
1. Introduction
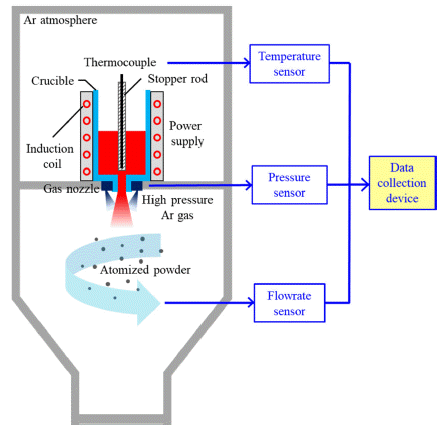
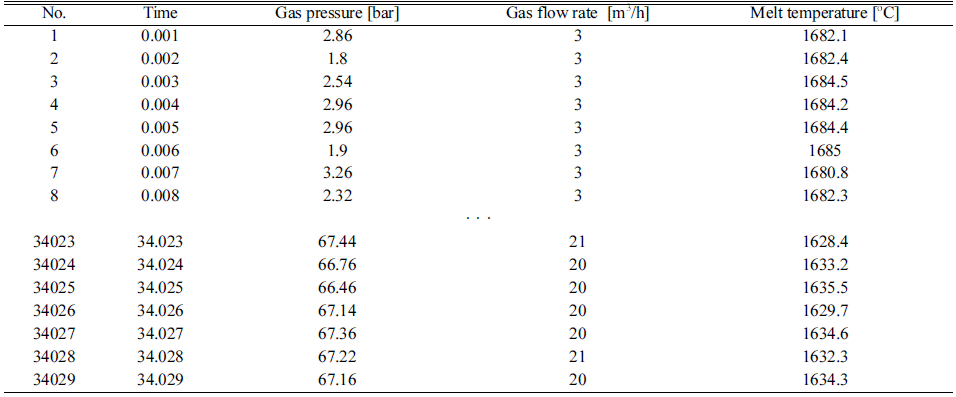
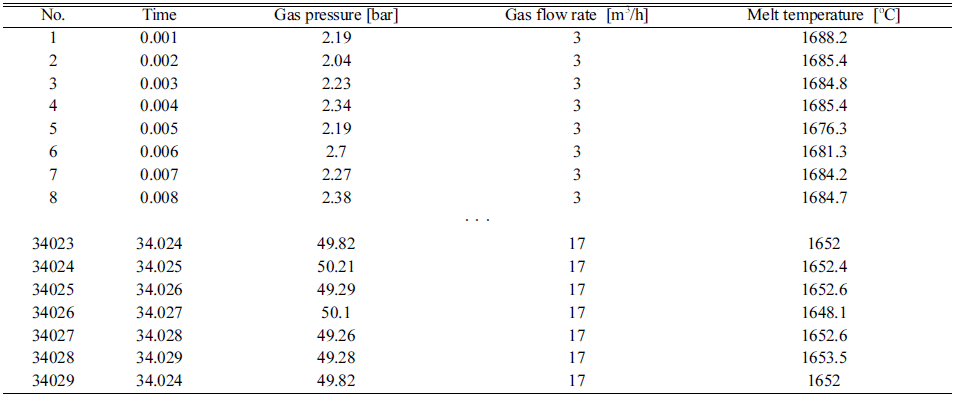
- In this study, the effect of VIGA factors on the characteristics of Fe-Si-Al-P soft magnetic powder was optimized. The atomization temperature, atomization gas pressure, and flow rate of atomization gas, which were variables in the VIGA process, were varied to collect data affecting the particle size, flowability, apparent density, and shape of the powder. Then, after learning the linear regression analysis and the surface reaction analysis method, the effects of the factors were analyzed. In order to manufacture Febal-Si3.5-Al0.5-P0.4 alloy powder, it was alloyed with electrolytic iron (>99.9 wt.%), metal silicon (>99.9 wt.%), and aluminum (>99.9 wt.%) A master alloy of Fe-P (26.37 wt.%) was prepared using a vacuum plasma melting system. Since Figure 1, 12 master alloys of 500 g each were loaded into an alumina crucible, and then a vacuum was applied to the atmosphere in the chamber. After application, inert gas (Ar) was flowed into the chamber to adjust the inert atmosphere. After melting at a temperature (1680°C) higher than the melting point (1450°C) of the master alloy through an induction furnace, the gas pressure was sprayed twice at 65 bar and 45 bar. The prepared powder was collected by measuring the weight of about 60 g each and dividing the powder into 57 zones. The atomization time for each round was 0.59 sec, and the total sprayed time was measured at 34 sec. Table 1 and Figure 2 show the conditions and the amount of data collected by the data acquisition device (GL-908, GRAPHTEC) at 1,000 data per sec for the atomizing temperature, atomizing gas pressure, and atomizing gas flow rate. Process data were also presented as representative mean values and standard deviation values by converting the data distribution over time into normally distributed data. Therefore, in the analysis, a total of 6 process factors, the average of the atomization gas pressure, the standard deviation of the atomization gas pressure, the average of the atomization temperature, the standard deviation of the atomization temperature, the average of the atomization gas flow rate, and the standard deviation of the atomization gas flow rate were used as input variables. In order to evaluate the characteristics of the Fe-Si-Al-P powder collected for each round, the particle size distribution was measured with a dynamic particle size analyzer (Laser Diffraction Method) ISO 13320-1 and the apparent density was measured according to ISO 3923-1 Density was calculated by obtaining the weight of the powder filled in the stainless steel mold having a volume of 21.2 cm3 using the Scott volumeter method according to the 12 standard. The flowability of the powder was measured by the flow time of 50 g of powder using a 2.5 Φ Hall Flowmeter according to ISO 4490 standards. For sphericity, the average value of three times was used by calculating the horizontal/vertical length of the powder as a ratio through image analysis. For this purpose, a scanning electron microscope (SEM, Quanta 200F). The output variables used in the analysis are a total of 6 ea, including particle size distribution (D10, D50, and D90), powder flowability, apparent density, and sphericity (aspect ratio) related to powder characteristics.
2. Experimental
- 3.1 Measurement data on the main factors of the VIGA process and the characteristics of the manufactured powder
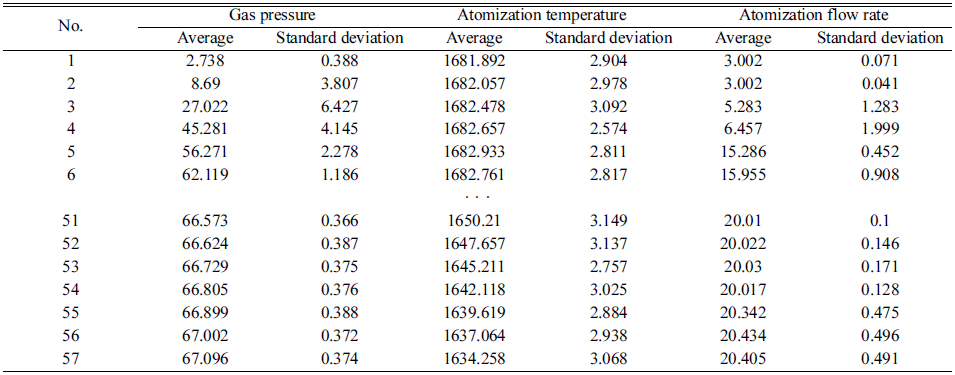
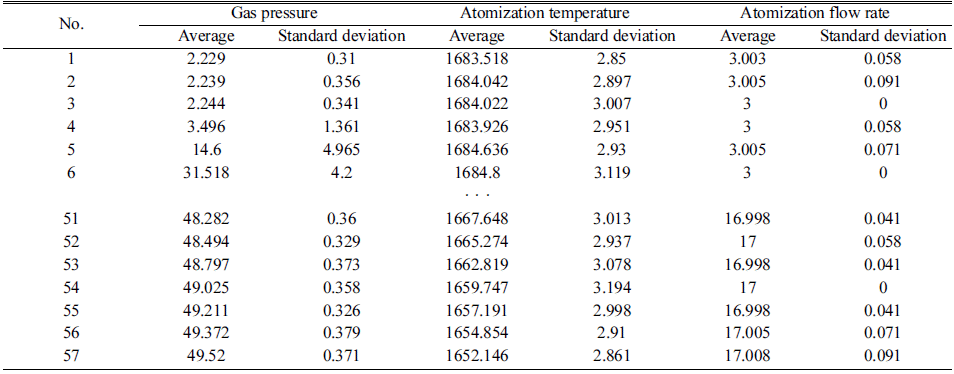
- The recorded raw data of powder Fe-Si-Al-P manufactured by the VIGA process were shown in Tables 2 and 3 with the set temperature, pressure, and flow rate at the start and end of atomization. The raw data in Tables 2 and 3 recorded the atomizing gas pressure, atomizing temperature, and atomizing gas flow rate at 1,000 microscopic changes per sec. It was confirmed that the measured values of the conditions set in the VIGA process could converge
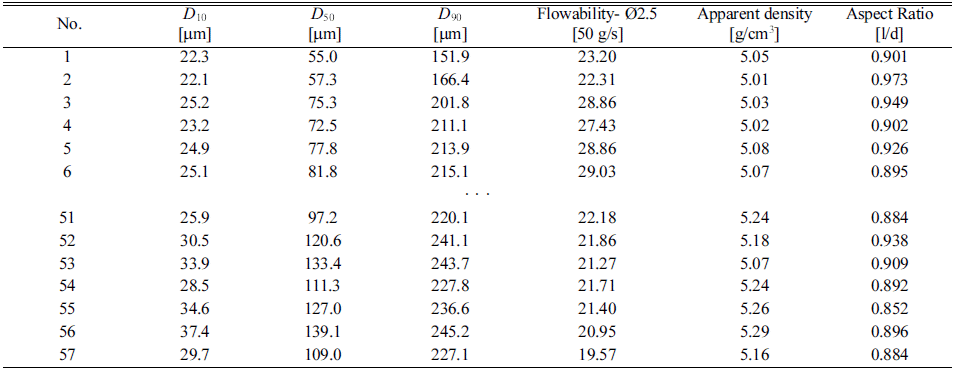
- After collecting the powder for each round, the characteristics were measured and the results recorded in Tables 4 and 5. In both processes, 57 particle size sizes of D10, D50, and D90, divided by rounds, and the flowability, apparent density, and sphericity of the powder were designated as powder characteristics. As shown in Tables 6 and 7, there were 57 data sets each, and a total of 114 data were measured through two experiments. The Fe-Si- Al-P alloy powder manufactured by the VIGA process was analyzed by setting a total of 114 measured data as dependent variables.
- 3.2 Data conversion of the main factors of the VIGA process and the characteristics of the manufactured powder
- Selecting a specific value among the input values of the data in Table 2 and Table 3 was close to impossible because the data were extensive. The average and standard deviation of the atomization gas temperature, atomization gas pressure, and atomization gas flow rate, which were detailed VIGA process manufacturing conditions that recorded 1000 data per second, were obtained for each round and recorded in Tables 6 and 7 to secure reliable data. Using this data, the average and standard deviation of the atomization gas temperature, atomization gas pressure, and atomization gas flow rate, which were a total of 6 process factors, were selected as input values, and the output targets include particle size (D10, D50, D90) and flowability, apparent density, and sphericity were adopted.
- 3.3 Sensitivity of process parameters of VIGA process to the properties of Fe-Si-Al-P alloy powder
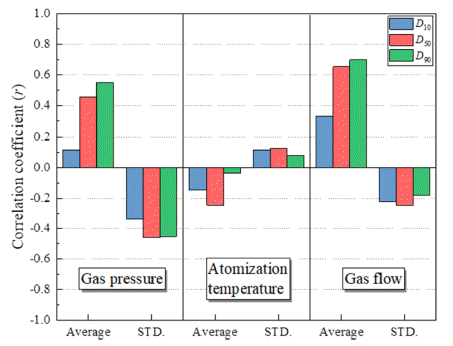
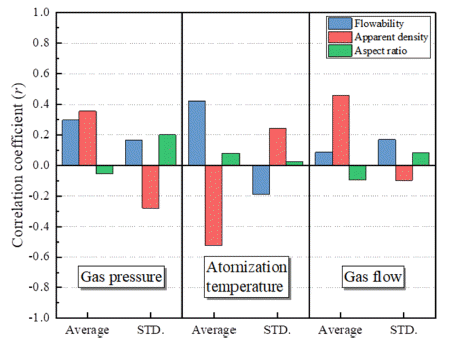
- A total of 6 characteristics of the Fe-Si-Al-P alloy powder manufactured by the VIGA process and the average and standard deviation of melt temperature, gas pressure, and gas flow rate, which were process variables in the VIGA process, were identified through Pearson’s correlation coefficient. Powder characteristics and process parameters were shown in Figure 3 to Figure 4 were shown. Correlation through Pearson’s correlation coefficient was selected and determined the conditions of the process parameters of the VIGA process for producing Fe-Si-Al- P alloy powder characteristics. As for the particle size distribution (D50) of the Fe-Si-Al-P alloy powder, the average of the atomization gas pressure and the average of the atomization gas flow rate had an r value of 0.455 and 0.655, respectively, which affected the production of fine powder. It was analyzed that the r values (The closer to 1, the more positive the relationship) of the gas flow standard deviation were -0.458 and -0.246, respectively, affecting the coarsening of the powder size. It was analyzed that the flowability of the powder had an effect on the average of the atomization temperature and the average of the gas pressure, and the apparent density had a significant effect on the average of the gas pressure, the atomization temperature, and the gas flow rate. In the sphericity of the powder, the r value was close to 0 and there is little correlation. Since the shape of the powder was determined by the means of the alloy composition and its liquid state characteristics, it was found that there was almost no correlation between the sphericity of the power and the VIGA process variables. It was found that referring to this correlation influenced the selection of input parameters for fabricating powders with desired characteristics.
- 3.4 Prediction model comparison
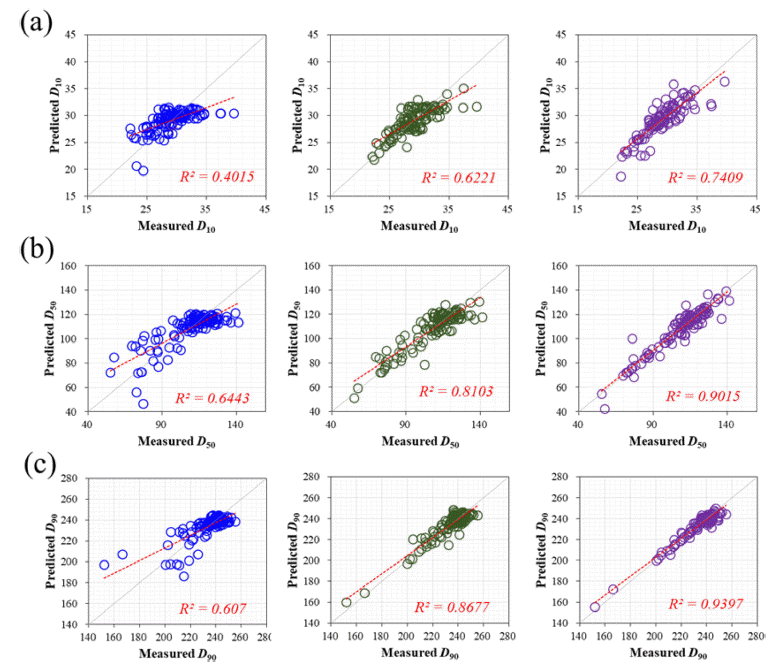
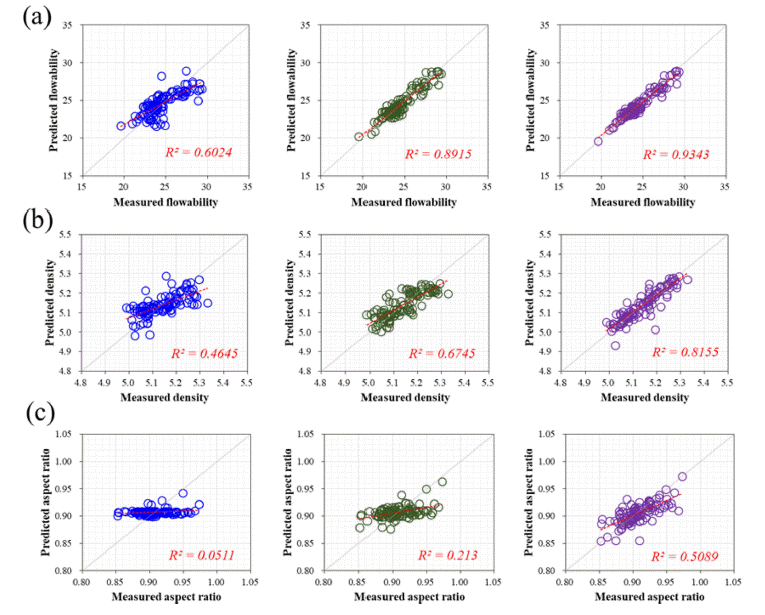
- Three models were used to predict the characteristics of the Fe-Si-Al-P alloy powder according to VIGA process conditions. For the three models, linear regression analysis was used first, and Response Surface analysis was used second. Finally, the predictive value was analyzed using an artificial neural network. From Figure 5 to Figure 6, the experimental data and prediction results of each model are shown in graphs and coefficients of determination. As a result of predicting 6 characteristics of the manufactured Fe-Si-Al-P alloy powder using three models such as linear regression analysis, response surface analysis, and artificial neural network model, the coefficient of determination (R2) in the case of a simple linear regression model 0.0511 ~ 0.6443, the prediction accuracy was not high, and when the response surface analysis method was used, it showed highly reliable prediction accuracy, 0.213 ~ 0.8915. When the artificial neural network model was applied, the most accurate prediction results were 0.5089 to 0.9397. It was thought that if the process condition was added to the artificial neural network model and trained, a higher prediction result value would be expected.
- Linear regression analysis is a simple model that explains the change in the dependent variable as the change in one independent variable in the case of Eq. (1). Y is the output variable, Xi is the input variable, β0 is the Y-intercept, βi is the slope, and εi is the random error. Response surface reaction analysis Eq. (2). is a model that infers a second-order polynomial using the least squares method and analyzes based on this equation. Where Y is the output variable, Xi and Xj are the input variable in coded levels, βi, βii and βij are the coefficient for linear, quadratic and interaction effects, respectively. β0 is the model coefficient. Eq. (3). of the artificial neural network model with high prediction accuracy is composed of fully coupled layers, unlike linear regression analysis and response surface analysis, and affects learn- ing according to the activation function. Y is the output variable, xi is the input variable, ωi is the weight value, b is the bias, and a is the activation function. According to the formula, it is judged that the prediction accuracy is higher than the two models because the formula of the artificial neural network model has higher learning efficiency than the formula of linear regression analysis and response surface analysis [11].
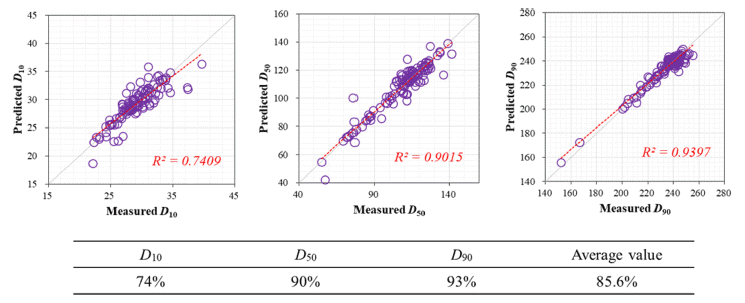
- As shown in Figure 7, which has excellent prediction results in the artificial neural network model, the average size of the particle size (D10, D50, and D90) was set as the experimental result value and compared with the learned predicted value of the artificial neural network model to obtain the prediction accuracy, resulting in an average of 85.6% confirmed.
3. Results and Discussion
Primary condition of VIGA process factors and average and standard deviation data for each powder recovery step: 1680°C, 65 bar, 65 m3/h
|
Primary condition of VIGA process factors and average and standard deviation data for each powder recovery step: 1680°C, 45 bar, 45 m3/h
|
Correlation between particle sizes D10, D50, and D90 which is a characteristic of Fe-Si-Al-P alloy powder, and process coefficient (r) of the VIGA process.
Correlation between a characteristic of Fe-Si-Al-P alloy powder (flowability, apparent density, and aspect ratio) and process coefficient (r) of the VIGA process.
Comparison of model prediction results for Fe-Si-Al-P alloy powder size: (a) D10, (b) D50, and (c) D90: blue (linear regression analysis), green (response surface analysis), purple (artificial neural network).
Comparison of model prediction results for Fe-Si-Al-P alloy powder: (a) flowability, (b) apparent density, and (c) aspect ratio: blue (linear regression analysis), green (response surface analysis), purple (artificial neural network).
3.4.1 Accuracy test using artificial neural network model and suitability of process
- In order to investigate the relationship between process parameters and powder characteristics of the Fe-Si- Al-P alloy powder manufactured by the VIGA process, the sensitivity of the input and output variables was analyzed through Pearson's correlation coefficient. In the particle size distribution (D50) of the powder, the average of the atomization gas pressure and the average of the atomization gas flow rate had an r value of 0.455 and 0.655, respectively, which affected the production of fine powder, and the r value of the atomization gas pressure standard deviation and the atomization gas flow rate standard deviation each -0.458 and -0.246 were analyzed resulting in influencing the coarsening of the powder size. It was analyzed that the flowability of the powder was affected by the average of the atomization melt temperature and the average of the atomization gas pressure, and the apparent density depended on the average of the atomization gas pressure, the atomization melt temperature, and the atomization gas flow rate. In the sphericity of the powder, the r value is close to 0 and there was little correlation with input variables. Since the shape of the powder was determined by the means of the alloy composition and its liquid state characteristics, it was found that there was almost no correlation between the sphericity of the power and the VIGA process variables.
- A total of 6 characteristics of the manufactured Fe-Si- Al-P alloy powders were compared with the prediction accuracy results through linear regression analysis, response surface analysis, and artificial neural network model. All three models showed predictive accuracy with coefficient of determination (R2) ranging from 0.0511 to 0.6443 in linear regression analysis, and when using response surface analysis, coefficient of determination (R2) value was 0.213 to 0.8915, showing higher predictive accuracy than linear regression analysis. In the artificial neural network model, which is a type of machine learning, it exhibited the highest prediction accuracy among the three models, ranging from 0.5089 to 0.9397.
- In the case of the artificial neural network model, higher prediction results were calculated than those of the linear regression analysis and response surface analysis, and accordingly, the experimental results of the particle size distribution (D10, D50, and D90) among the output targets of the powder were predicted by the artificial neural network model. In terms of coefficient of determination, denoted R2, it was confirmed that the average prediction accuracy was 85.6%.
4. Conclusions
-
Acknowledgements
- This research was developed by the Korea Institute of Industrial Technology project (No. JH220003) funded by the Korea Institute of Industrial Technology (KITECH). The project name is Development of platform core technology of diamond reinforced metal matrix composites for heat spreader based on artificial intelligence.
Acknowledgments
- 1. R. Hasegawa: J. Magn Magn Mater., 215-216 (2000) 240. .Article
- 2. H. J. Kim: J. Korean Mang. Soc., 21 (2011) 77. .
- 3. D. G. Kim and C. J. Choe: Inst. Electr. Eng., 66 (2017) 15. .
- 4. S. H. Lee, B. T. Kim and J. H. Cho: Korean Inst. Electr. Eng., 63 (2014) 25. .
- 5. B. S. Kim and M. H. Lee: Korea Ceram. Soc., 18 (2015) 5. .
- 6. B. Ziębowicz, D. Szewieczek and L. A. Dobrzański: J. Mater. Manuf. Eng., 20 (2007) 207. .
- 7. R. Tamura, T. Osada, K. Minagawa, T. Kohata, M. Hirosawa, K. Tsuda and K. Kawagishi: Mater. Des., 198 (2021) 1. .Article
- 8. H. J. Liu, H. L. Su, W. B. Geng, Z. G. Sun, T. T. Song, X. C. Tong, Z. Q. Zou, Y. C. Wu and Y. W. Du: J. Supercond. Novel Magn., 29 (2016) 463. .Article
- 9. N. H. Goo and J. H. Lee: Korean J. of Met. Mater., 33 (2020) 23. .
- 10. S. H. Ryu, B. O. Kong, K. C. Kim, K. W. Lee and Y. S. Lee: Korean J. Met. Mater., 33 (2020) 8. .
- 11. J. Jeon, D. E. Kim, J. H. Hong, H. J. Kim and S. J. Lee: Korean J. Met. Mater., 60 (2020) 1..
Figure & Data
References
Citations


Fig. 1
Fig. 2
Fig. 3
Fig. 4
Fig. 5
Fig. 6
Fig. 7
Table 1
Table 2
Table 3
Table 4
Table 5
Table 6
Table 7
TOP
 KPMI
KPMI



 ePub Link
 Cite this Article


