Abstract
- This study investigated the densification behavior of rhenium alloys including W-25 wt.%Re and Re-2W- 1Ta (pure Re) during sintering. The dilatometry experiments were carried out to obtain the in-situ shrinkage in H2 atmosphere. The measured data was analyzed through shrinkage, strain rate and relative density, and then symmetrically treated to construct the linearized form of master sintering curve (MSC) and MSC as a well-known and straightforward approach to describe the densification behavior during sintering. The densification behaviors for each material were analyzed in many respects including apparent activation energy, densification parameter, and densification ratio. MSC with a minimal set of preliminary experiments can make the densification behavior to be characterized and predicted as well as provide guideline to sinter cycle design. Considering the results of linearized form and MSC, it was confirmed that the W-25 wt.%Re compared to Pure Re is more easily densified at the relatively low temperature.
-
Keywords: Densification behavior; Rhenium alloy; Sintering; Master sintering curve
Introduction
- Rocket nozzle is widely used for a mechanical part such as a tactical missile, weather and surveillance satellite. Such a Rocket nozzle works in the high temperature and pressure, because the enormous amounts of exhaust gas containing a high temperature produced by combustion pass through throat-area which is the smallest crosssection area. Therefore, the material for a Rocket nozzle must have good mechanical properties such as a high melting point, a good thermal shock properties, and a low coefficient of thermal expansion to keep the performance of propulsion. In general, graphite and carbon-carbon composites have been widely used as nozzle materials to reduce the erosion rate of throat-area. However, the erosion rate of those materials is not enough to maintain propulsion. In this regard, there have tried to employ different types of materials to reduce an increase of throat-area by erosion. Considering the thermal properties like a melting temperature, refractory metals are possible candidates for a noneroding Rocket nozzle in the ultra-high temperature and pressure [1].
- Refractory materials including rhenium, niobium, tantalum, molybdenum and tungsten are the extraordinarily resistant materials against heat and wear. These materials have unique mechanical properties such as a high melting point, boiling point and density. Of all the refractory materials, rhenium has an unique mechanical properties such that its melting temperature of 3180oc exceeds all other metals except tungsten. Even though rhenium has lower melting point than tungsten-rhenium, it has a better ductility at high temperature compared to other refractory materials [2]. In addition, rhenium has the highest tensile strength among the refractory materials under the high temperature.
- The rhenium has a distinguishable mechanical property so-called rhenium effect. This mechanical property comes from its crystal structure i.e. rhenium have the closed-packed hexagonal, while other refractory metals has the body-centered cubic structure. Its HCP structure has a high solubility in transition metals having BCC and FCC structures [3]. This characteristic enables the rhenium to form an alloy e.g. W-Re (Tungsten-Rhenium alloy), Mo-Re (Molybdenum-Rhenium alloy). These alloys make the mechanical properties such as a tensile strength, plasticity, and weldability enhanced. In order to determine the optimum composition of Re-alloy, the phase change should be considered through the phase diagram. For instance, W-Re has the optimum solubility limitation of W with 26 wt.% Re to avoid the sigma (σ) phase which has brittle mechanical property.
- There have been several studies for the refractory materials, especially related to producing method for rhenium alloy [4-10]. As the most common method to form the rhenium component, chemical vapor decomposition (CVD) and powder metallurgy (P/M) have been considered. Both methods are employed to fabricate the small or complex-shaped components. While CVD is considered as a clean method, it is not easy to produce the components in quantity. Although the P/M is suitable method for mass production, it is difficult to produce the complex shape. In this regards, the PIM is an attractive method from manufacturing point of views including shape complex and mass production.
- In manufacturing industries, PIM process is a productive and cost-effective net-shaping process which combines advantages of both plastic injection molding and conventional powder metallurgy. This process has many advantages of shape complexity, tight tolerances, and material selection of metals and ceramics. Once desired materials, mold geometries, and process parameters are decided, PIM is an appropriate process for the mass production. The PIM process consists of four steps; (i) mixing – producing the pelletized feedstock of the powder and organic binders, (ii) molding – injecting the feedstock melt into the mold cavity, similar with thermoplastics; (iii) debinding – extracting or removing the organic binders out of injection molded part via solvents or the thermal energy, (iv) sintering – densifying the debound part from the low initial density to the high final density, close to the full density [11-14].
- One of the key steps for the P/M or PIM process is the sintering which is a thermally activated diffusion process. Sintering is a complex process involving the evolution of the microstructure as well as simultaneous actions related to several transport mechanism. The processing conditions for sintering can affect the mechanical properties such as the microstructure and density. Especially, the density plays a vital role to evaluate the merchantability of sintered parts. The density of sintered parts is strongly correlated with final dimension as well as strength of a part, since the occupied pores in the parts are eliminated by bonding together into a coherent, solid mass during the sintering. Therefore, not only does it demand intense effort to understand the sintering behavior but also to determine the proper processing conditions. The densification behavior associated with many factors such as particle size, morphology and processing conditions can be analyzed using master sintering curve (MSC) model and linearized form of MSC. Many researchers have been studied to analyze and predict a densification behavior through the MSC [15-24]. The MSC suggested by Su and Johnson (1996) [15] can characterize the densification behavior with minimum set of experiments. The linearized form of MSC proposed by Blaine et al. (2009) [21] provides the information of model parameters including n and ln Θref. Those parameters, n and ln Θref, have the physical meanings that n for a power law exponent is how fast densification occurs, and Θref for the half-way point between initial density and final density during the sintering is how much the densification occurs. Those parameters are obtained from the experimental data.
- This study investigates the densification behavior of W- 25 wt.%Re and pure Re during sintering. Section 2 presents the preliminary backgrounds in MSC and its sigmoid function representation. In Section 3, the experimental procedures including characteristics of W-25 wt.%Re and pure Re, experimental conditions and setups are briefly mentioned to produce the specimens. Section 4 presents the results of experiments and analysis of MSC. Finally, conclusions and contributions of this study are presented in Section 5.
Theory of MSC
- It is very difficult to predict the sintering behavior, because sintering related to several transport mechanisms is affected by many factors including materials and processing conditions. In order to overcome those difficulties, there are many attempts to find general sintering model. Among many attempts, MSC model was developed by Su and Johnson (1996) [15] to predict the densification behavior using a combined stage sintering model [25].
- where γ is the surface energy, Ω is the atomic volume, k is the Boltzmann’s constant, T is the absolute temperature, G is the mean grain diameter, and G is a lumped scaling parameter. As D0 is the diffusivity pre-exponent, the exponent n relies on the diffusion mechanism. If the sintering is dominated by volume diffusion (n = 3) or grain boundary diffusion (n = 4), D0 is expressed by D0 = (Dv)0 and D0 = (δDb)0, respectively. In Eq. (1), it is assumed that G and γ are a function of density. Therefore, Eq. (1) can be classified by the groups of density dependent parameters and the process-dependent parameters. The right-hand side of Eq. (1) is defined as work of sintering (Θ);
- The Θ includes processing parameters (t and T) and apparent activation energy (Q). Even though the processing parameters are given by dilatometry experiments, the Q should be obtained. The activation energy is generally calculated by linear fitting of experimental data [26, [27]. In this study, the normalized mean residual method as an alternative method is employed to obtain Q [15, [27]. The mean residual is defined as follows [21];
- where ρ0 is the initial relative density, ρf is the final relative density, N is the total number of dilatometry experiments, Θ ρ,i is the work of sintering up to the density ρ of i-th dilatometry experiment and Θρ is the average work of sintering up to the density ρ for all experiments. Once arbitrary Q is given, the work of sintering can be calculated in Eq. (2) and then mean residual is determined in Eq. (3). Therefore, the best estimator of Q would be obtained from plot of mean residual against given values of Q, when the mean residual has the smallest value.
- The MSC model is described by a sigmoid function as follows;
- The shape of sigmoid function representing the densification behavior is determined by constant parameters, a and b, which can be obtained by linearized form of MSC suggested by Blaine et al. (2009) [21].
Experimental Procedures
-
3.1. Powder characterization
- W-Re powder and Pure Re powder (Both powders were provided by CetaTech, Inc.) were prepared by a reduction process. The optimum composition of W-Re is highly related to the solubility limit as shown in Fig. 1. In this study, in order to avoid the formation of hard and brittle σ-phase, W-25 wt.%Re powder was fabricated and used for P/M process.
- The particle size of powders was measured by particle size analyzer (Particle Size Analyzer, CILAS 1064), as illustrated in Fig. 2. The particle sizes of D10, D50, and D90 for each powder are 3.22, 9.74, and 18.35 mm for W-25 wt.%Re powder and 94.32, 291.14, and 450.38 for pure Re powder. The distribution slope parameter (Sw) calculated by Eq. (5) for W-25 wt.% Re and pure Re are 3.387 and 3.770, respectively. This parameter is just value to represent how broadly particle is distributed. Considering that the easiest powders to mold exhibit Sw of less than 4, the obtained values of 3.387 and 3.770 are within a reasonable range of the reference value for Sw. Powder size of pure Re is much larger than W-25 wt.%Re powder in the whole range.
- From the histogram measured by the particle size analyzer, the powder has a slightly bi-modal distribution as shown in Fig. 2(a).
- It means that the two powders were not perfectly alloyed. Some particle surfaces were covered with wary rods with submicron size, while a small part being not alloyed Re powder existed. According to Cory C. Spark (2012) [30], we can guess if it took a longer time for the reduction process to fabricate a homogeneous distribution of W-25 wt.%Re powder, the alloyed particle might be Gaussian distribution in size. However, it is not necessary to employ a perfectly alloyed W-25 wt.%Re powder without σ-phase. Even though the alloyed powder produced by the reduction process prior to sintering has the potential to aid homogenization and decreases the intermetallic contents such as σ or χ-phases in the microstructure, it is not essential condition. The histogram of pure Re as shown in Fig. 2(b) also has a slightly bi-modal distribution at round 100 μm because of a small addictive of W and Ta.
-
3.2. Dilatometry experiment
- Dilatometry experiments (Dilatometer, DIL 402C) were carried out for investigating densification behavior during sintering. The samples were prepared by die pressing (DP) with a height of 15 mm and a diameter of 7 mm in cylindrical shape. The initial relative densities of W-25 wt.%Re and pure Re were approximately 0.44 and 0.42, respectively. These experiments were undergone in a H2 atmosphere to keep Re from oxidizing on the surface as following thermal cycles; i) in the first step, all samples were heated at the same heating rate of 10°C/min from 30 to 1000°C; ii) in the second step, each sample was heated at different heating rates of 2, 5, and 10°C/min from 1000 to 1550°C, respectively; iii) in the third step, all samples were held for 1 h and iv) in the last step, all samples were cooled by same cooling rate of 10°C/min to the room temperature, as shown in Fig. 3. In order to construct the MSC for analyzing densification behavior, three different heating rates in second step were used. The experiments were carried out up to pre-sintering temperature of 1550°C.
Results and Discussion
- The dilatometry experiments were carried out for measuring in-situ shrinkage during sintering, and then the obtained data were systemically treated by using the MSC concept. The experiments were conducted by 1550°C, since our diltometer was available up to maximum temperature of 1650°C. This temperature range was included in an initial and intermediate states. Hence, the densification behavior of W-25 wt.%Re and pure Re was experimentally investigated up to relative density of about 0.80 and 0.54, respectively.
- The results were analyzed in terms of shrinkage, shrinkage rate and relative density. Figs. 4 and 5(a), (b) and (c) show the shrinkage (engineering strain), shrinkage rate (strain rate) and relative density with the temperature, respectively. All samples were thermally expanded up to the temperature of 1000°C (first step). In the second step, those were shrunk by densification. The strain rate varied with heating rates. The temperature at which strain rate were maximized increased as the heating rate increased. i.e. the maximum strain rates of W-25 wt.%Re and pure Re for each heating rate of 2, 5, and 10°C/min are summarized in Table 1.
- This result indicates that the lower heating rate can densify the sample at the relatively low sintering temperature. In addition, phase change which can be confirmed by a strain rate was not observed in W-25 wt.%Re. According to Blaine et al. (2009) [21], the phase change leads to a sharp increase or decrease of strain rate. Considering phase diagram and strain rate, brittle σ-phase was not formed in this sintering condition. However, the strain rate of pure Re increases a little bit at the temperature of 1250°C. It is deduced that this change is caused by a small amount of W and Ta. During the cooling, the samples were thermally shrunk up to the room temperature (third step). The relative density were calculated by Eq. (6), since the density and shrinkage were interrelated in an isotropic sintering.
- where ρ0 is the initial relative density, and dL/L0 is timedependent linear shrinkage obtained by dilatometry experiment. Compared with Fig. 4(c) and Fig. 5(c), the relative density of W-25 wt.%Re maintains a higher level than pure Re at the same temperature. This result indicates that W-25 wt.%Re can be more easily densified.
- The MSC suggested by Su and Johnson (1996) [15] can be described by the relationship between the sintered density (ρ) and the work of sintering (Θ) which includes time (t), temperature (T) and apparent activation energy (Q). The proper Q was determined through minimization of the mean residual. The proper Q can be numerically calculated by Eq. (3). Once an arbitrary Q is given, a mean residual can be calculated. After repeating the calculation of mean residuals with different Q, the mean residuals were plotted against given values of Q. When the mean residual was a minimum value in a given range of Q, the best estimator of Q was determined. Fig. 6 shows the plot of the mean residuals with Q. The Q of W-25 wt.%Re and pure Re were found to be 228 kJ/mol and 39 kJ/mol, respectively. There was no reported data to compare the obtained Qs. The Q means the sensitivity to temperature during sintering. The higher Q leads to the more densification at the same temperature. The difference of Qs between W-25 wt.%Re and pure Re is confirmed by difference of relative densities. i.e. the higher Q of W-25 wt.%Re results in the higher relative density compared to pure Re.
- The MSC for a relationship between ρ and Θ can be described by a sigmoid function. The shape of a sigmoid function depends on the constant parameters, a and b which were obtained by a linearized form of MSC suggested by Blaine et al. (2009) [21]. In order to simplify the sigmoid function, alternative parameters are employed. By using the densification ratio (Φ), the sigmoid function (Eq. (4)) can be expressed by linear equation. Since the parameters provide information for densification behavior, those are useful to intuitionally understand its mechanism of sintering. These constant parameters in the linearized form have the physical meanings as follows; i) a indicates the densified quantities when the densification reaches halfway of the full density, ii) b implies that how fast the densification occurs. Fig. 7(a) and (c) shows the linearized form of MSC for W-25 wt.%Re and pure Re, respectively. In order to construct the linearized form of MSC, the parameters, i.e. densification ratio (Φ) and densification parameter (Ψ) were used. These parameters, Φ and Ψ, were defined as follows [21];
- and
- where Θref is the work of sintering halfway through densification, i.e., up to density ρ = (ρ0 + 1)/2, and n is a power law exponent. The quantity Θref is obtained from the experimental data and means the halfway point between initial density and final density during sintering. The slope of curve and the value of a were calculated from curve fitting based on the linearized model. These values were used to define the MSC as shown in its sigmoid function form in Figs. 7(b) and (d). Considering the correlation coefficient (R2) of 0.996, the linearized curve with experimental data was well fitted. From the result of n, it is confirmed that the densification of pure Re is faster than W-25 wt.%Re. However, the halfway of densification for W-25 wt.%Re is lower than pure Re. It means that the densification of W-25 wt.%Re is more activated than pure Re at the same temperature.
- MSC was built by Ψ instead of ρ. By using Ψ, the densification behavior can be analyzed regardless of their different values of initial relative densities. Fig. 7(b) and (d) show the MSC. The sigmoid function was well fitted with experimental data. The densification behavior was estimated up to the full density. Therefore, the entire range of densification behavior can be predicted. Considering MSC as shown in Fig. 7(b) and (d), the sigmoid function of W-25 wt.%Re is leftside than pure Re. This results of MSC are in agreement with the earlier result of the halfway of densification (Θref)) in linearized form.
Conclusions
- The densification behavior of the W-25 wt.%Re and pure Re was characterized using the dilatometry tests and MSC approach which can make densification behavior to be predicted as well as provides guideline to analyze sinter cycle design. As compared with W-25 wt.%Re and pure Re, the densification of pure Re is faster than W-25 wt.%Re. However, the W-25 wt.%Re is more easily densified at the relatively lower temperature. It indicates that W-25 wt.%Re can be more easily produced.
AcknowledgementsAcknowledgments
- This research was supported by Korea Agency for Defense Development and the National Research Foundation of Korea (NRF) grant funded by the Korea government (MSIP) (No. 2011-0030075).
Fig. 1.Phase diagram for tungsten-rhenium [28].
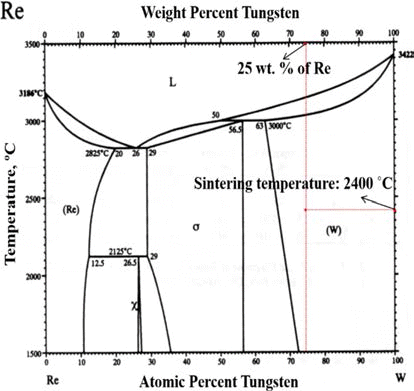
Fig. 2.Particle size distributions: (a) W-25 wt.%Re powder [29] and (b) Re-2W-1Ta powder.
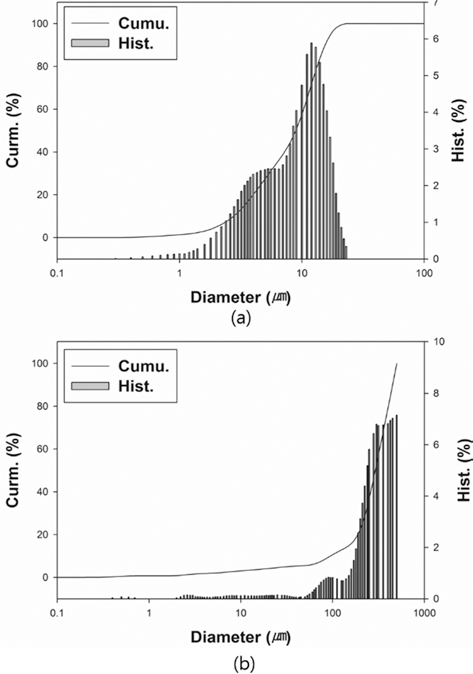
Fig. 3.Sinter cycle for dilatometry experiments [29].
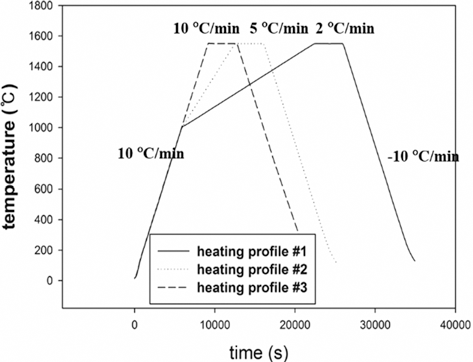
Fig. 4.Plot of dilatometry results for W-25 wt.%Re: (a) shrinkage, (b) strain rate and (c) relative density [29].
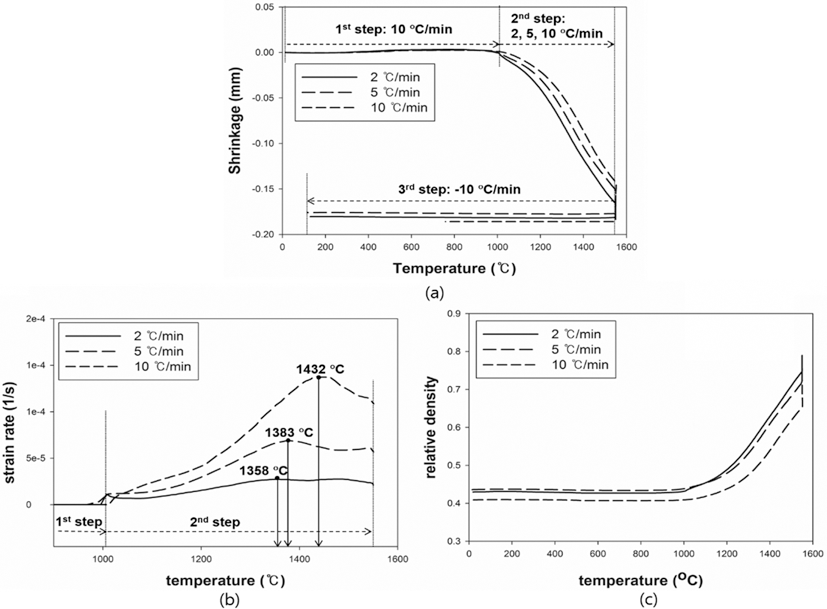
Fig. 5.Plot of dilatometry results for pure Re: (a) shrinkage, (b) strain rate and (c) relative density.
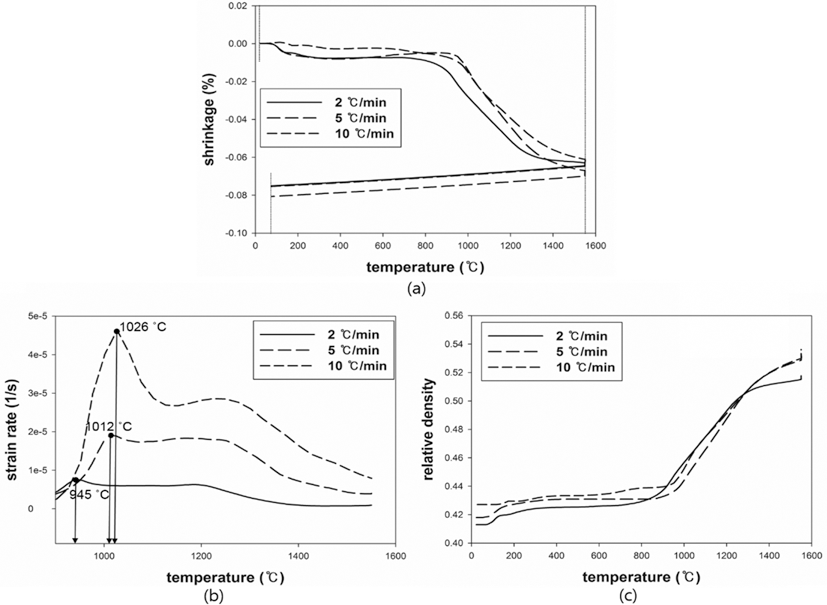
Fig. 6.Plot of mean residual with Q: (a) W-25 wt.%Re [29] and (b) pure Re.
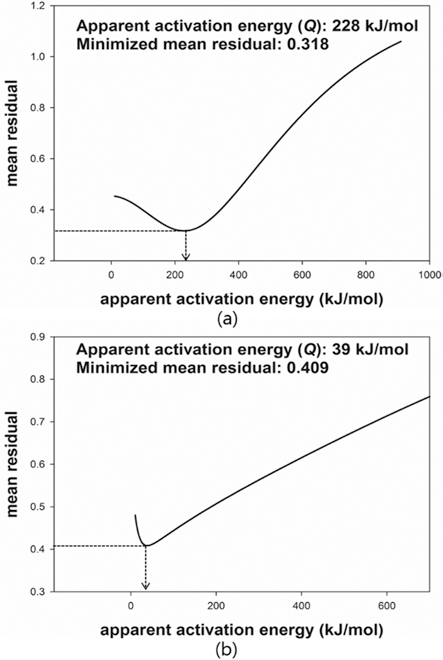
Fig. 7.Linearized form of MSC and Sigmoid function plot, (a, b) W-25 wt.%Re [29] and (c, d) Re-2W-1Ta.
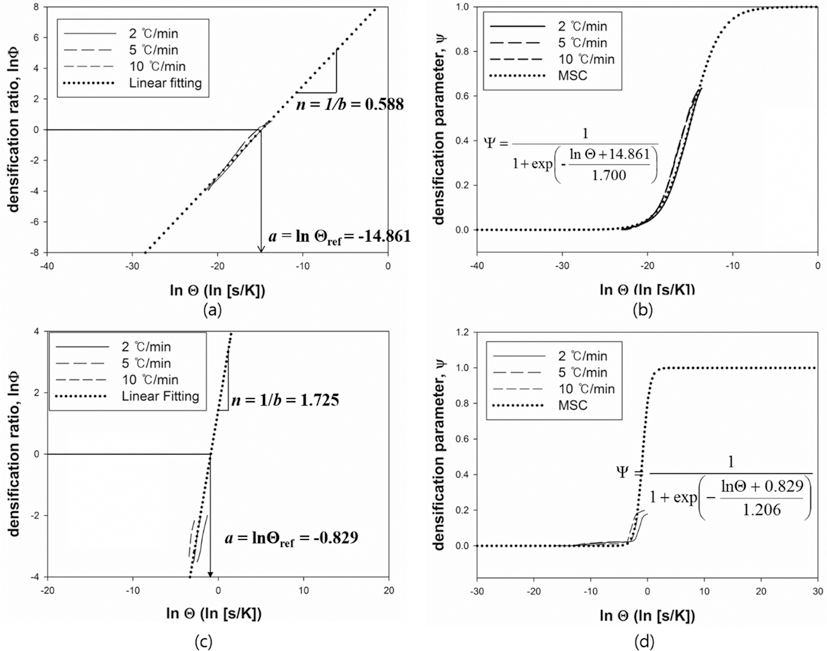
Table 1.Maximum strain rates for each heating rate
|
Heating rate |
Compound |
|
|
W-25 wt%Re |
Pure Re |
|
|
2°C/min |
1358 |
945 |
|
5°C/min |
1383 |
1012 |
|
10°C/min |
1432 |
1026 |
REFERENCES
- 1. P Thakre and V Yang, J. Propul. Power. (2009) 25 40.Article
- 2. K Upadhya, J Yang and W Hoffman, ‘Advanced Materials for Ultrahigh Temperature Structural Applications Above 2000 deg C’. Technical Report. (1997.
- 3. J. C Carlen and B. D Bryskin, Mater Manuf. Process. (1994) 9 1087.Article
- 4. R Hickman and T McKechnie, Advanced Materials and Processes for Boost Phase Nozzles. (2004) In: 40th AIAA/ASME/ SAE/ASEE Joint Propulsion Conference and Exhibit; Fort Lauderdale, Florida.
- 5. R Hickman, T McKechnie and J O’Dell, Material properties of net shape, vacuum plasma sprayed rhenium and tungsten. (2003) In: 39th AIAA/ASME/SAE/ASEE Joint Propulsion Conference; Juntsville, Alabama.
- 6. T Hayashi, S Takaoka, A Ichida, H Ohara and T Yoshioka, Mater. Manuf. Proces. (1994) 9 1047.Article
- 7. K Nagarathnam, A Renner, D Trostle, D Kruczynski and D Massey, Development of 1000-Ton Combustion-Driven Compaction Press for Materials Development and Processing. (2007) 1 In: 2007 MPIF/APMI International Conference on Powder Metallurgy & Particulate Materials; Colorado. 3.
- 8. R. L Mannheim and J. L Garin, Key. Eng. Mat. (2001) 189 302.
- 9. G Leichtfried, J. H Schneibel and M Heilmaier, METAll. Mater. Trans. A. (2006) 37 2955.ArticlePDF
- 10. T. N McKechnie, R. R Hickman and A Argarwal, ‘Low Cost, Net Shape Fabrication of Rhenium and High Temperature Materials for Rocket Engine Components’. Technical Report. (2001.
- 11. L Liu, N. H Loh, B. Y Tay and S. B Tor, Powder. Technol. (2011) 206 246.Article
- 12. R. M German and A Bose, Injection molding of metals and ceramics. Metal Powder Industrie. (1997.
- 13. F. V Lenel, Powder metallurgy: principles and applications. Metal Powder Industries. (1980.
- 14. D. Y Park, S. W Lee, S. J Park, Y-S Kwon and I Otsuka, Metall. Mater. Trans. (2013) 44 1508.ArticlePDF
- 15. H. H Su and D. L. J Johnson, Am. Ceram. Soc. (1996) 79 3211.ArticlePDF
- 16. D. C Blaine, J. D Gurosik, S. J Park, D. F Heaney and R. M German, Metall. Mater. Trans. A. (2006) 37A 715.
- 17. D. C Blaine, S. J Park, P Suri and R. M German, Metall. Mater. Trans. A. (2006) 37A 2827.
- 18. S. J Park, J. M Martin, J. F Guo, J. L Johnson and R. M German, Metall. Mater. Trans. A. (2006) 37A 2837.
- 19. S. J Park and R. M German, IJMIS. (2007) 1 128.Article
- 20. S. J Park, S. H Chung, J. M Martin, J. L Johnson and R. M German, Metall. Mater. Trans. A. (2008) 39A 2941.
- 21. D. C Blaine, S. J Park and R. M. J German, Am. Ceram. Soc. (2009) 92 1403.Article
- 22. S. J Park, P Suri, E Olevsky and R. M. J German, Am. Ceram. Soc. (2009) 92 1410.Article
- 23. I. M Robertson and G. B Schaffer, Metall. Mater. Trans. A. (2009) 40A 1968.
- 24. R Bollina, S. J Park and R. M German, Powder. Metall. (2010) 53 20.Article
- 25. J. D Hansen, R. P Rusin, M. H Teng and D. L. J Johnson, Am. Ceram. Soc. (1992) 75 1129.Article
- 26. Z. Y Liu, N. H Loh, K. A Khor and S. B Tor, Scripta. Mater. (2001) 44 1131.Article
- 27. K Saitou, Scripta. Mater. (2006) 54 875.Article
- 28. P. R. R Naidu Nagender, Phase Diagrams of Binary Tung sten Alloys ASM International Place. (1991) 232.
- 29. D. Y Park, Y. J Oh, Y. S Kwon, S. T Lim and S. J Park, Int. J. Refract. Met. H. (2014) 42 205.Article
- 30. C. C Sparks, Fabrication of Solid Solution Tungsten-rhenium Alloys by High Energy Ball Milling and Spark Plasma Sintering. Materials Science and Engineering Boise State University. (2012.
Citations
Citations to this article as recorded by

- The influence of sintering time on the microstructural properties of chromium-rhenium matrix composites
Marcin Chmielewski, Szymon Nosewicz, Dorota Jakubowska, Małgorzata Lewandowska, Jarosław Mizera, Jerzy Rojek, Piotr Bazarnik
International Journal of Refractory Metals and Hard Materials.2016; 59: 78. CrossRef


 KPMI
KPMI


 Cite this Article


