
Articles
- Page Path
- HOME > J Powder Mater > Volume 31(2); 2024 > Article
-
Research Article
- Data-driven Approach to Explore the Contribution of Process Parameters for Laser Powder Bed Fusion of a Ti-6Al-4V Alloy
- Jeong Min Park1,*, Jaimyun Jung2,*, Seungyeon Lee1, Haeum Park1, Yeon Woo Kim1, Ji-Hun Yu1
-
Journal of Powder Materials 2024;31(2):137-145.
DOI: https://doi.org/10.4150/jpm.2024.00038
Published online: April 30, 2024
1Department of 3D Printing Materials, Korea Institute of Materials Science (KIMS), Changwon, Gyeongnam 51508, Republic of Korea
2Department of Materials AI & Big-Data, Korea Institute of Materials Science (KIMS), Changwon, Gyeongnam 51508, Republic of Korea
-
*Corresponding Author: Jeong Min Park, TEL: +82-055-280-3502, E-mail: jmpark@kims.re.kr
*Corresponding Author: Jaimyun Jung, TEL: +82-055-280-3136, E-mail: jjm0475@kims.re.kr - 김지영, 이의선, 최지원, 김영민: 학생, 오승탁: 교수
• Received: April 2, 2024 • Revised: April 19, 2024 • Accepted: April 19, 2024
© The Korean Powder Metallurgy & Materials Institute
- 6,565 Views
- 158 Download
- 8 Crossref
Abstract
- In order to predict the process window of laser powder bed fusion (LPBF) for printing metallic components, the calculation of volumetric energy density (VED) has been widely calculated for controlling process parameters. However, because it is assumed that the process parameters contribute equally to heat input, the VED still has limitation for predicting the process window of LPBF-processed materials. In this study, an explainable machine learning (xML) approach was adopted to predict and understand the contribution of each process parameter to defect evolution in Ti alloys in the LPBF process. Various ML models were trained, and the Shapley additive explanation method was adopted to quantify the importance of each process parameter. This study can offer effective guidelines for fine-tuning process parameters to fabricate high-quality products using LPBF.
- Recently, the engineering community has been highly impressed by the high degree of design freedom of metal additive manufacturing (MAM), or metal 3D printing [1-3]. In particular, laser powder bed fusion (LPBF) is the most famous MAM technique due to its high precision and flexibility in designing and producing bulk metallic components [3, 4]. By using LPBF, one can directly print 3D products in a layer-by-layer fashion through selective melting of fine metallic powders by a high-energy laser beam according to 3D computer-aided design (CAD) data [5]. For the high demands of industrial fields (e.g., aerospace, medical, mobility, etc.), various types of materials are commercially used in LPBF [6-9].
- The prevention of macroscopic defects in LPBF-processed materials is essential for the reliability and durability of engineering parts, but the materials are usually accompanied by porosity defects due to complexity associated with multiple printed layers with a complex thermal history during the process [10]. It has been widely reported that heat input during the LPBF has a dominant effect on the evolution of porosity defects in the processed parts [10, 11]. If heat input is too low, the metallic powder is partially un-melted during the LPBF, which produces a lack of fusion (LOF) defect having a sharp shape between melt pools. Moreover, when heat input is too excessive during LPBF, gas pore or key-hole defects can evolve in the processed materials [12].
- Therefore, heat input is carefully controlled to produce defect-free parts by using LPBF. A common practice in controlling heat input is to control laser power, laser scanning speed, or hatch distance to obtain the LPBF process window of materials [13-15]. The volumetric energy density (VED) has been commonly used to estimate the heat input to the processed materials by considering major process parameters as below [16-18]:
- where the Ev is the VED, the P is the laser power, the v is the laser scan speed, the h is the hatch distance, and the l is the layer thickness. While the VED can be regarded as a powerful guidance to evaluate the heat input from the complex parameters of LPBF, it is not an omnipotent index in predicting defect evolution of the LPBF-processed materials due to following limitations: (1) materials properties (i.e., thermal conductivity, melting point, etc.) are not reflected in the VED calculation, and (2) it is assumed that process parameters contribute equally to the heat input despite each parameter affecting the heat input in a different mechanism. For example, in the case of materials having low LPBF printabilty (e.g., pure copper, H13 steel, etc.), it is difficult to produce defect-free sample based on VED if the laser power is insufficient for the same VED value [7, 19, 20]. Therefore, an investigation to explore the contribution of process parameter to defect evolution in the materials is needed for expanding the applicability of materials to LPBF.
- Artificial intelligence (AI)-based method for process optimization in various science and engineering fields has been attracting considerable attention due to its remarkable performance [21-23]. In this study, the contribution of process parameters in the LPBF to the density of the LPBF-processed sample was explored based on techniques for explainable AI. The Ti-6Al-4V alloy was used for the present study, which is a representative material commercially used in LPBF due to its favorable printability for obtaining a wide process window as well as irreplaceable industrial merits (i.e, high specific strength, excellent load-bearing capacity, and superior biocompatibility) [9, 24, 25]. The contributions of the laser power and laser scan speed, which are commonly regarded as the major process parameters for controlling heat inputs, are quantitatively compared by using various machine learning (ML) models.
1. Introduction
- 2.1. Sample fabrication and characterization
- Spherical powder of Ti-6Al-4V alloy (KOS global ltd., Republic of Korea) in a particle size range of 10–55 μm was prepared for LPBF process. In order to ensure the data reliability of the present study, two types of powders of Ti-6Al-4V alloy having different oxygen contents as grade 5 (1727 ppm) and grade 23 (997 ppm) were used for sample fabrication [8]. Cuboidal blocks (10 mm × 10 mm × 10 mm) were printed in an island scanning pattern with 67° rotation in every layer by using a commercial LPBF machine (M2 Series 5, GE additive, USA). The 81 samples for each powder (the total number of samples: 162 EA) were printed under the fixed parameters of a hatch distance of 0.10 mm and a layer thickness of 30 μm with controlling the laser powder (100 – 300 W, 25 W interval) and laser scan speed (400 – 2000 mm/s, 200 mm/s interval) in an Ar atmosphere, as shown in Fig. 1. The relative density of samples was measured by Archimedes method (ML204T, Mettler Toledo, USA). The cubic samples were divided into four parts, and the density measurement was repeatedly performed for three parts. For the remaining specimen among the four parts, optical micrograph (OM) analysis was performed on the finely polished surface of the sample using an OM (ECLIPSE MA200, Nikon Co., Japan).
- 2.2. Machine learning model training procedure
- In order to predict the relative density of LPBF-processed Ti-6Al-4V alloy based on the process parameters, different ML models were trained for Shapley additive explanation (SHAP) to quantify the importance of process parameters. The overall procedure for training ML models is summarized as presented in Fig. 2. Firstly, Synthetic minority over-sampling technique for regression with Gaussian noise (SMOGN) [26] was adopted to alleviate the imbalance within the original dataset as well as to augment the data for model training and testing. From the original dataset, 69 and 71 synthetic data points were generated using SMOGN for grade 23 and grade 5 alloys, respectively. The original dataset for each alloy was then split in half. The first half was designated as test data while the remaining half, together with the SMOGN generated synthetic data, was designated as training data.
- Finally, five different supervised ML models, namely, artificial neural network (ANN), Gaussian process regression (GPR), adaptive boosting (AdaBoost) regression, support vector regression (SVR), and random forest (RF) regression models were trained and tested using the augmented dataset. Key parameters used for each model are summarized in Table 1. The hyperparameters of GPR, AdaBoost, SVR, and RF models were fitted through exhaustive grid search. The hyperparameters of ANN was optimized through Optuna, an open source hyperparameter optimization framework. The noise parameter of GPR model was empirically fitted. The same parameters were used in training models for grade 23 as well as grade 5 alloys. Data normalization was applied prior to training the models.
2. Experimental Procedure
- 3.1. Defect evolution in the samples
- Fig. 3 shows the variation of relative density of the LPBF-processed samples as a function of laser scan speed in different laser power conditions. For both Ti alloys, when the laser scan speed is lower than 800 mm/s, the relative density of the samples gradually decreased. On the other hands, when the scan speed is too high, the relative density of the samples rapidly decreases with increasing scan speed. This tendency is much more severe in the samples printed at lower laser power conditions. For example, for the samples printed at the laser power of 100 W, the relative density is drastically decreased by increasing laser scan speed over ~800 mm/s.
- Figs. 4 and 5 presents the OM images of the finely polished surface perpendicular to building direction of the Gr. 23 Ti-6Al-4V samples printed at different laser power and scan speeds. As shown in Fig. 4, the samples printed at low laser power and high scan speed exhibit the porous structure. Most of samples printed at low scan speed (<600 mm/s) involve a high fraction of spherical pores. Based on VED calculation (Eq. (1)), the volumetric heat input to the processed materials decreases when the laser scan speed increases due to increasing exposure time of the laser beam [14]. Therefore, it can be observed that the LOF defects, having a large size (> ~100 μm), are evolved in the samples printed under the low laser power and high laser scan speed, as presented in Fig. 5(a). On the contrary, for the samples printed under the high laser power and low scan speed, spherical gas pores are evolved due to excessive heat input, as shown in Fig. 5(b).
- Based on Eq. (1), the relative density as a function of VED of the Gr. 5 and Gr. 23 samples could be plotted as presented in Fig. 6. It is noted that the relative density of the LPBF-processed Ti-6Al-4V alloys maintains roughly ~99% in a VED range from ~50 J/mm3 to ~100 J/mm3. When the VED decreases below ~50 J/mm3, the relative density drastically decreases due to profuse evolution of LOF defects. On the other hands, strikingly, the relative density vs. VED plots exhibit serrated behavior under the high VED over ~100 J/mm3. This demonstrates that the relative density of the LPBF-processed Ti alloys can be varies by process parameters despite the same VED under high heat input conditions, while the relative density is dominantly dependent on VED under low heat input conditions.
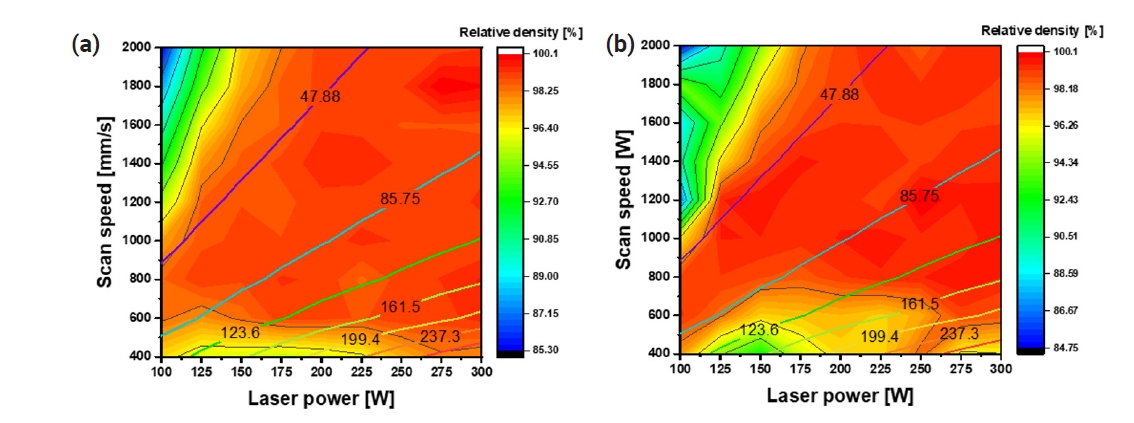
- Fig. 7 shows the VED contour lines overlaid on relative density map of the LPBF-processed Ti-6Al-4V alloys at different laser power and scan speeds. Noticeably, while the value of relative density is generally proportional to the VED below the VED of ~50 J/mm3, the relative density of the samples is different even on the same VED line under conditions of high heat inputs. Interestingly, it can be observed that the relative density of the samples printed at high laser power is higher than those at low scan speeds on the same VED line under high heat input conditions. It implies that increasing laser power is more advantageous for obtaining high relative density of the LPBF-processed Ti-6Al-4V alloy than lowering the scan speed even with the same VED line.
- 3.2. ML model analysis
- In order to quantitatively explore the contributions of laser power and scan speed for obtaining high-density samples printed by LPBF, various ML models were trained for SHAP study. The performance of the models for Gr. 23 Ti alloy evaluated through test data is summarized in Table 2. One can see that all the models perform reasonably well in terms of relative error and R2 measure. Among the models, GPR, Adaboost, and ANN models stand out. Their maximum relative error is less than 2% and their R2 score is above 0.97. The GPR model exhibits the highest predictive performance, where the maximum and average relative errors are less than 1% with an R2 score of 0.99.
- The performance of the models for Gr. 5 Ti alloy evaluated through test data is summarized in Table 3. Generally, all models perform reasonably well in terms of relative error and R2 score. The relative error index reveals that the predictive performance of the models for Gr. 5 samples is comparable to that of models for Gr. 23 samples. However, the overall R2 score of models for Gr. 5 samples seems to be lower than that of the models for Gr. 23 samples. This is likely due to the bias within the dataset. The density distribution of the original dataset for Gr. 23 samples was more well-distributed than that of the original dataset for Gr. 5 samples.
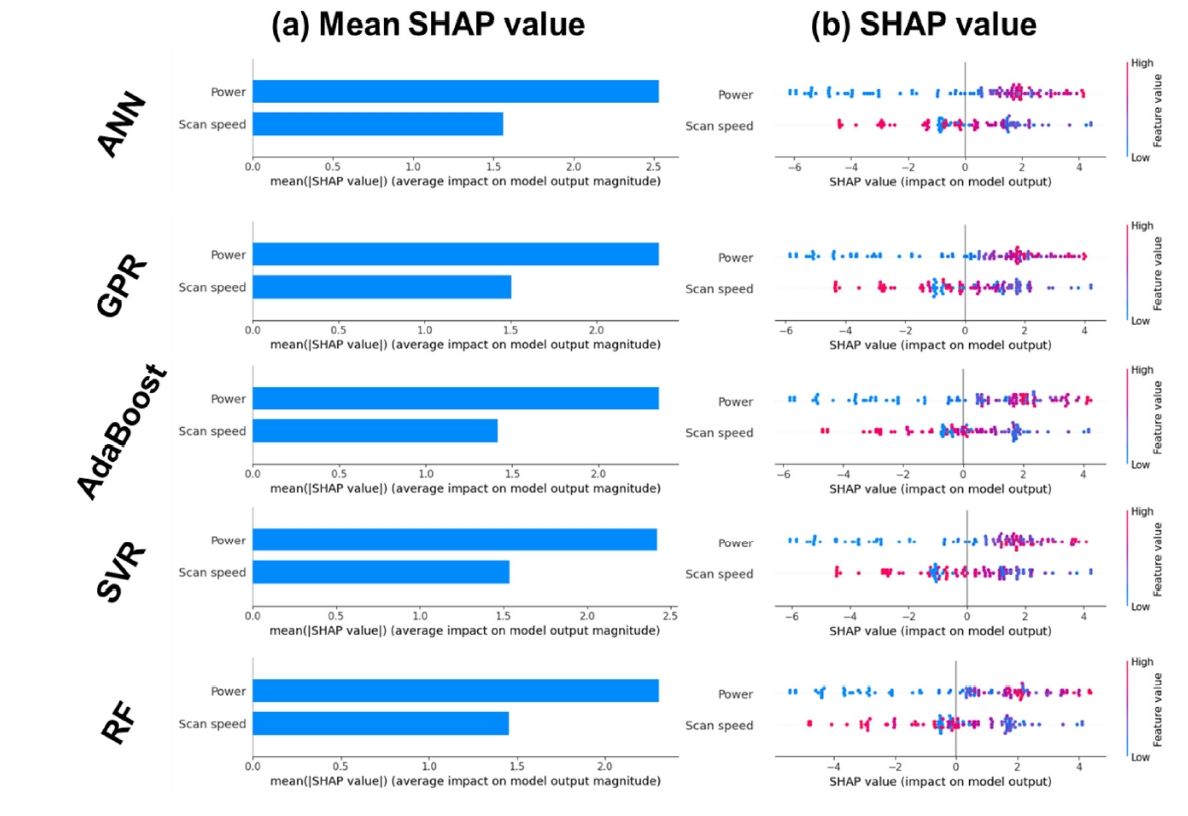
- Feature importance of laser power and scan speed as they are perceived by different models is shown in Fig. 8. Expectedly, laser power is directly correlated with relative density while scan speed is inversely correlated with relative density (Fig. 8(a)). Fig. 8(b) reveals an interesting result in which mean SHAP value of laser power is larger than that of scan speed. That is, laser power poses a greater impact on relative density of Ti alloys than scan speed does. In detail, the mean SHAP value of power and scan speed are 0.66 and 0.69 for ANN and GPR models, respectively. The mean SHAP value differences calculated using RF and SVR models which are slightly larger (0.87 and 0.90) than those calculated using ANN and GPR models. The mean SHAP value difference calculated using AdaBoost models is above 1.17. Similar observations can be made with Gr. 5 Ti alloy (Fig. 9). This is in line with the experimental findings in Fig. 7.
- This aspect can be also accorded with experimental observation of LPBF-processed alloys [27, 28]. Luo et al. [27] recently investigated the effect of processing parameters on pores in LPBF-processed Ti-6Al-4V alloy. They also observed that the process window (the number of possible combinations of laser power and scan speed for obtaining dense samples) can be widened by increasing laser power rather than decreasing scan speed at the same VED levels [27].
- Roughly speaking, the importance of laser power and scan speed on the relative density of the processed samples is likely to be around 60% and 40%, respectively, for both Gr. 5 and Gr. 23 alloys based on every ML model used in the present study. It demonstrates that laser power contributes 1.5 times more significantly compared to scan speed for obtaining dense samples printed by LPBF. This exploration can provide guidelines for fine-tuning the LPBF process parameters to produce dense metallic products having high quality.
3. Results and Discussion
- In this study, the contribution of laser power and scan speed in LPBF for the fabrication of dense Ti-6Al-4V alloy using LPBF was explored by experimental characterization and ML model training. While the relative density of the LPBF-processed Ti alloys is generally proportional to the VED under low heat input conditions, accompanying LOF defects, the relative density is higher in the samples printed at high laser power than those at tlow scan speed at the same VED under high heat input conditions. It demonstrates that increasing laser power is more advantageous to produce dense Ti-6Al-4V alloy using LPBF than lowering the scan speed.
- In order to quantify the contribution of laser power and scan speed to the relative density of the samples, SHAP analysis was performed by training various ML models. The mean SHAP value of laser power is larger than that of scan speed, which demonstrates the laser power poses a greater impact on the relative density of Ti-6Al-4V alloys than scan speed does. When comparing the SHAP value between the laser power and scan speed, the laser power contributes 1.5 times more significantly compared to scan speed for the density of the Ti-6Al-4V alloy printed by LPBF. It also implies the process window of producing dense Ti alloys can be expanded when increasing the laser power in the LPBF process. This investigation can provide beneficial guidelines for controlling process parameters to fabricate high-quality products using LPBF.
4. Conclusion
-
Acknowledgements
- This work was supported by Principal R&D Project (PNK9950) of the Korean Institute of Materials Science (KIMS), Basic Research Program (PICO960) of Korea Institute of Machinery and Materials (KIMM), and the project of “Development of powder and parts manufacturing technologies for 3D printing of high strength lightweight metals” through the Ministry of Trade, Industry, and Energy (Project No. 20013202).
Fig. 1.(a) Printing strategy to produce the samples, and (b) an optical photograph of the as-printed samples.
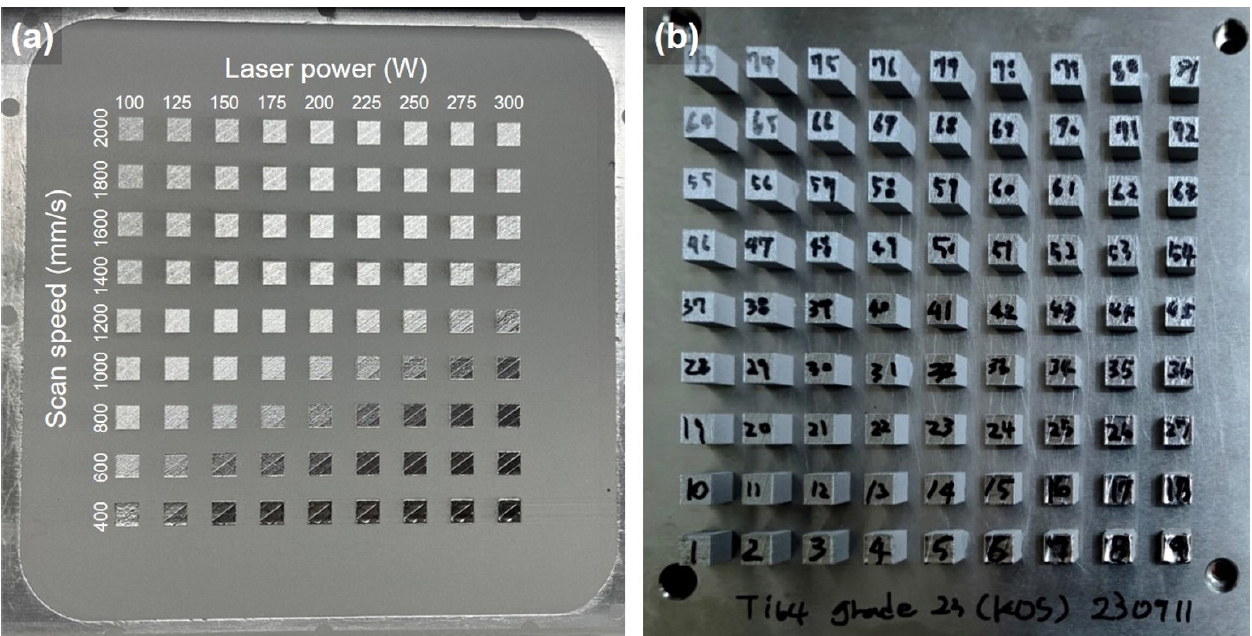
Fig. 2.Flow chart of the overall process of constructing machine learning models for laser powder bed fusion (LPBF)-processed Ti alloys.
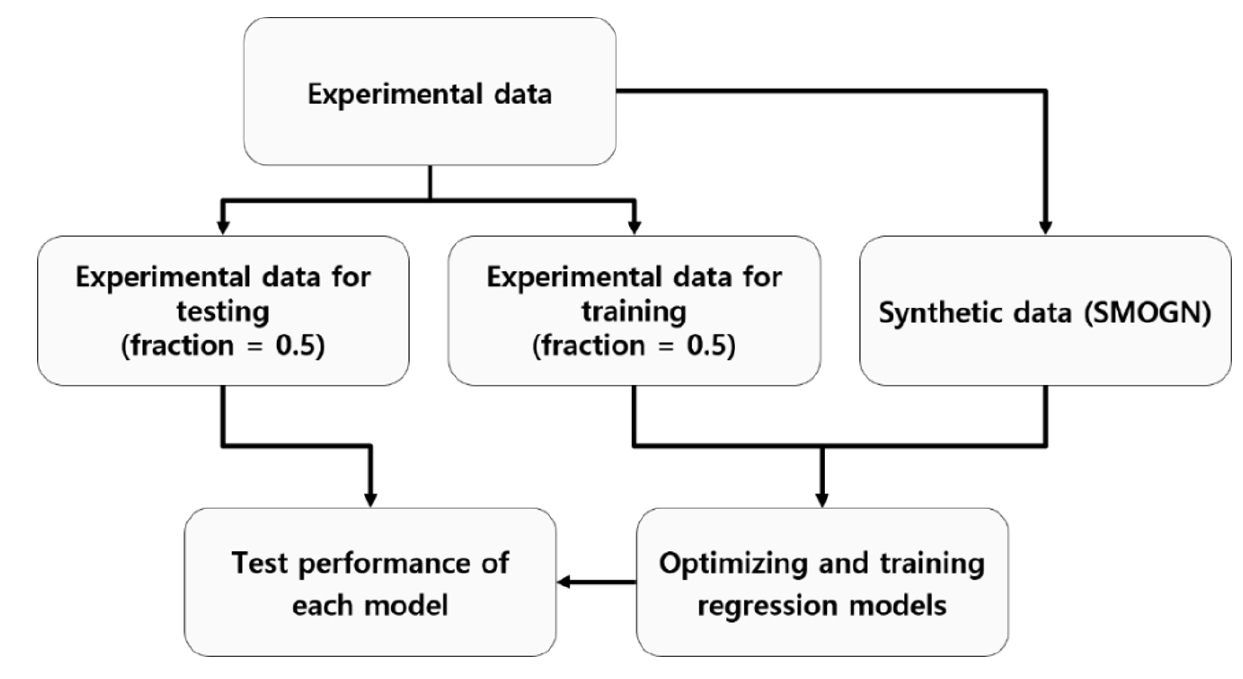
Fig. 3.Relative density as a function of laser scan speed of the (a) Gr. 5 and (b) Gr. 23 Ti alloys printed at different laser power levels.
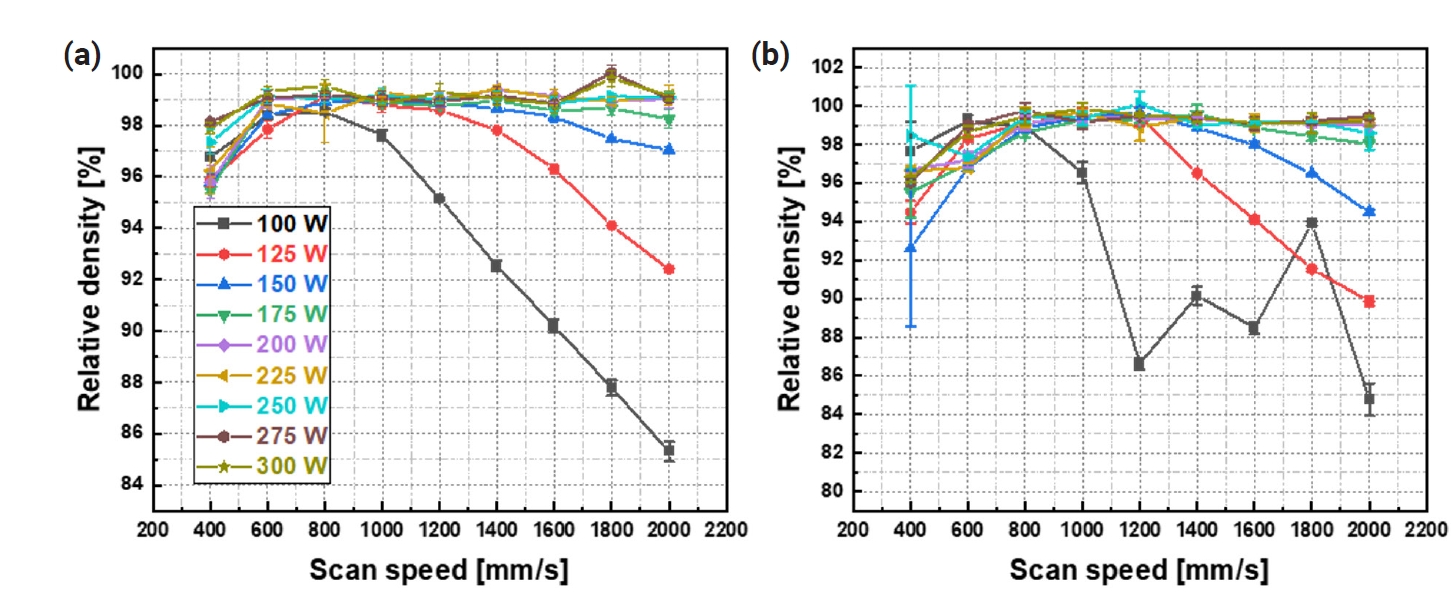
Fig. 4.Optical microscopy images for the lateral surface of the Gr. 23 Ti alloys printed by laser powder bed fusion (LPBF) at different laser powers and scan speeds.
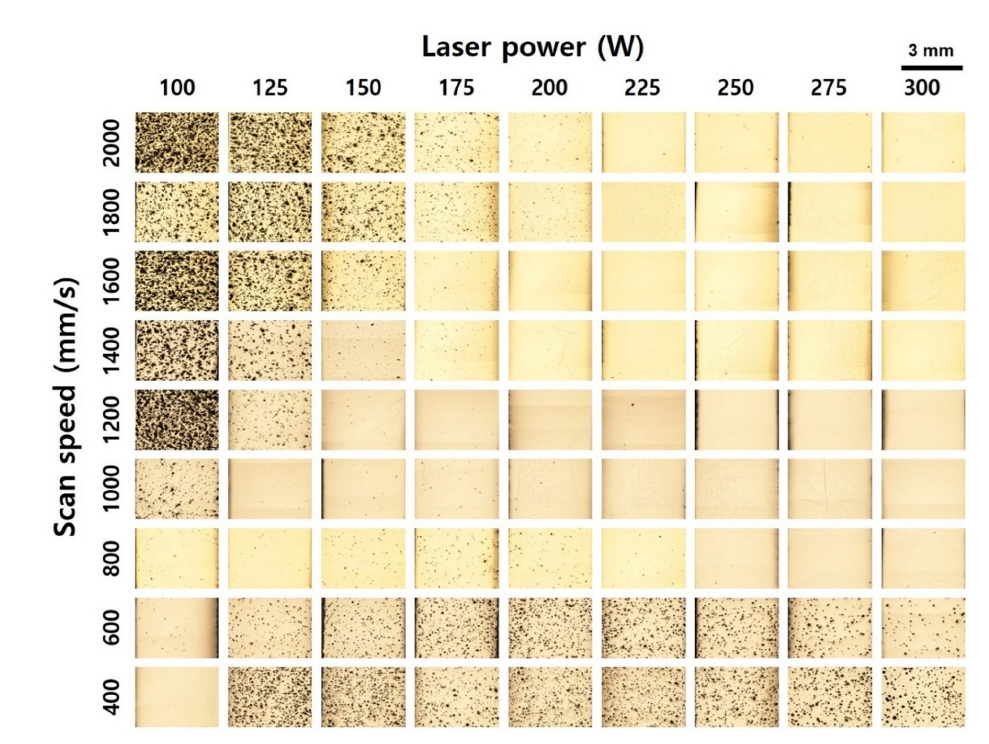
Fig. 5.Optical microscopy images presenting (a) lack of fusion defects in a sample printed at a low volumetric energy density (VED) and (b) gas pores in a sample printed at a high VED.
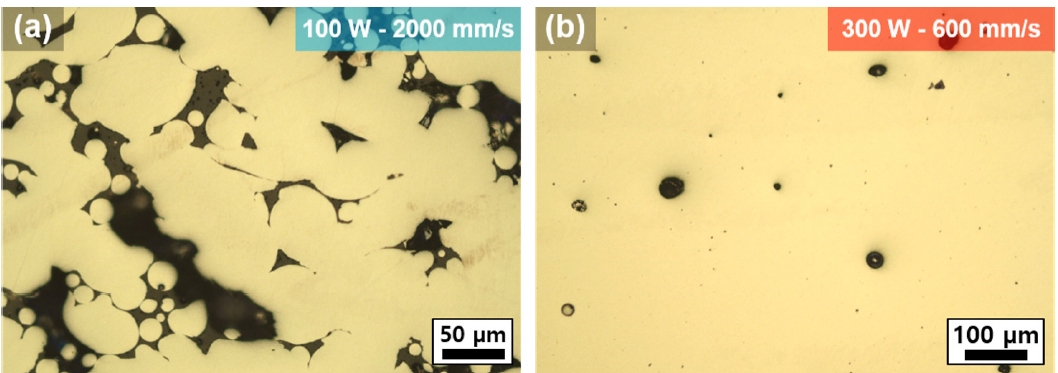
Fig. 6.Relative density as a function of volumetric energy density (VED) for the (a) Gr. 5 and (b) Gr. 23 Ti alloys printed by laser powder bed fusion (LPBF).
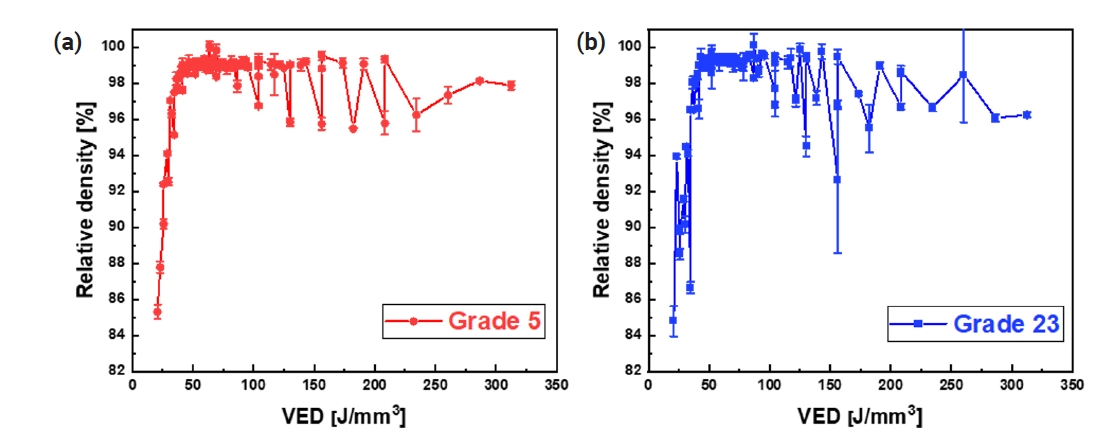
Fig. 7.Volumetric energy density (VED) contour lines overlaid on relative density maps of the (a) Gr. 5 and (b) Gr. 23 Ti alloys printed by laser powder bed fusion (LPBF) at different laser powers and scan speeds.

Fig. 8.(a) Summary mean |SHAP value| plot and (b) distribution of SHAP values of processing variables based on different models for the Gr. 23 alloy.
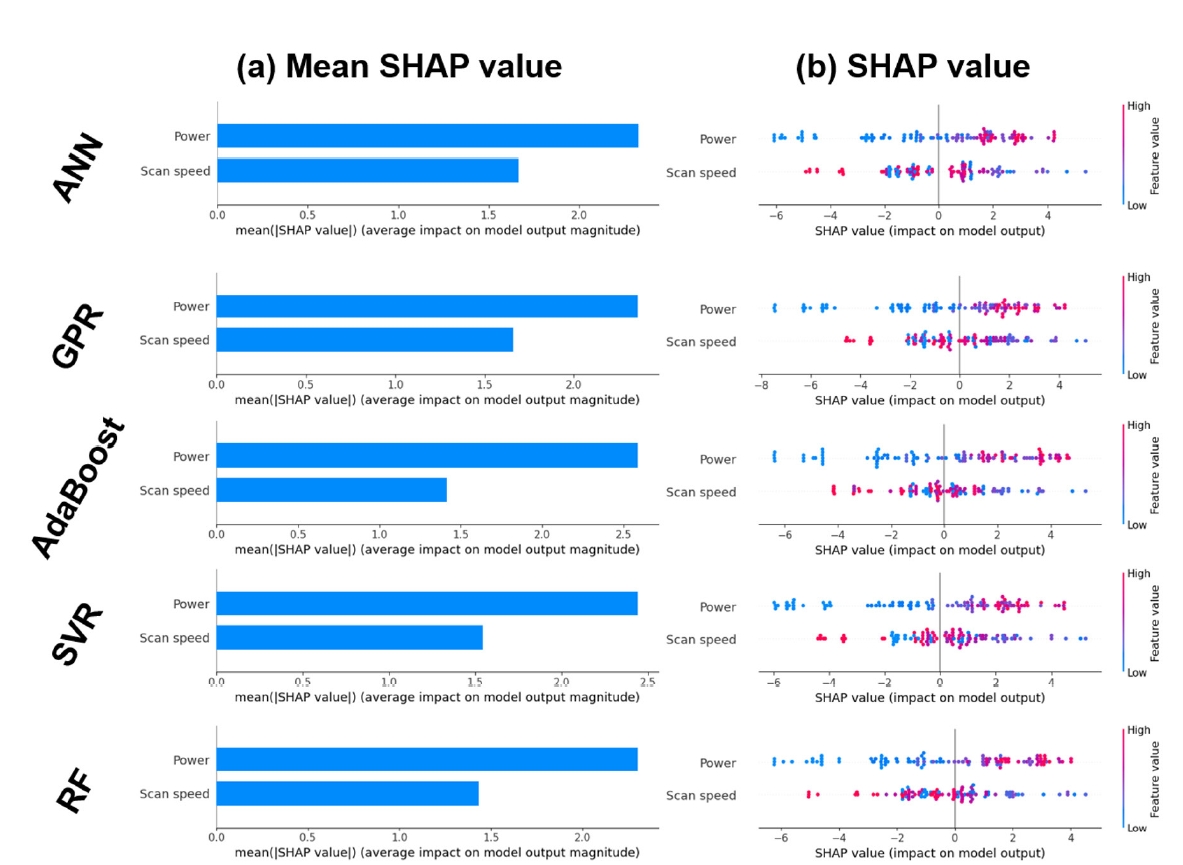
Fig. 9.(a) Summary mean |SHAP value| plot and (b) distribution of SHAP values of processing variables based on different models for the Gr. 5 alloy.

Table 1.Parameters used to train each model
Table 2.Performance of each model evaluated using test data for the Gr. 23 Ti alloy
| ANN | GPR | AdaBoost | SVR | RF | |
|---|---|---|---|---|---|
| Maximum relative error (%) | 1.66 | 0.73 | 1.07 | 4.09 | 3.51 |
| Average relative error (%) | 0.31 | 0.15 | 0.18 | 0.72 | 0.49 |
| R2 score | 0.98 | 0.99 | 0.99 | 0.88 | 0.93 |
Table 3.Performance of each model evaluated using test data for the Gr. 5 Ti alloy
| ANN | GPR | AdaBoost | SVR | RF | |
|---|---|---|---|---|---|
| Maximum relative error (%) | 2.20 | 1.30 | 2.26 | 1.47 | 1.44 |
| Average relative error (%) | 0.22 | 0.27 | 0.25 | 0.39 | 0.28 |
| R2 score | 0.94 | 0.90 | 0.85 | 0.83 | 0.88 |
- 1. J. Ren, Y. Zhang, D. Zhao, Y. Chen, S. Guan, Y. Liu, L. Liu, S. Peng, F. Kong, J. D. Poplawsky, G. Gao, T. Voisin, K. An, Y. M. Wang, K. Y. Xie, T. Zhu and W. Chen: Nature., 608 (2022) 62.ArticlePDF
- 2. Z. Qu, Z. Zhang, R. Liu, L. Xu, Y. Zhang, X. Li, Z. Zhao, Q. Duan, S. Wang, S. Li, Y. Ma, X. Shao, R. Yang, J. Eckert, R. O. Ritchie and Z. Zhang: Nature., 626 (2024) 999.ArticlePDF
- 3. J. M. Park: J. Powder Mater., 29 (2022) 132.Article
- 4. J. M. Park, H. Kwon, J. Choe, K. T. Kim, J.-H. Yu, Y.-U. Heo and H. S. Kim: Scr. Mater., 237 (2023) 115715.Article
- 5. J. M. Park, E. S. Kim, H. Kwon, P. Sathiyamoorthi, K. T. Kim, J. H. Yu and H. S. Kim: Addit. Manuf., 47 (2021) 102283.Article
- 6. Y. S. Eom, J. M. Park, J. W Choi, D. J. Seong, H. Joo, Y. C. Jo, K. T. Kim, J. H. Yu and I. Son: J. Alloys Compd., 956 (2023) 170348.Article
- 7. Y. W. Kim, H. Park, Y. S. Eom, D. G. Ahn, K. T. Kim, J.-H. Yu, Y. S. Choi and J. M. Park: J. Powder Mater., 66 (2023) 582.ArticlePDF
- 8. T. J. Kang, P. L. Narayana, S. W. Choi, J. H. Kim, J.-K. Hong and T. Lee: Korean J. Met. Mater., 61 (2023) 714.ArticlePDF
- 9. S. Liu and Y. C. Shin: Mater. Des., 164 (2019) 107552.Article
- 10. S. Wang, J. Ning, L. Zhu, Z. Yang, W. Yan, Y. Dun, P. Xue, P. Xu, S. Bose and A. Bandyopadhyay: Mater. Tod., 59 (2022) 133.Article
- 11. J. M. Jeon, J. M. Park, J.-H. Yu, J. G. Kim, Y. Seong, S. H. Park and H. S. Kim: Mater. Sci. Eng. A., 763 (2019) 138152.Article
- 12. J. M. Park, P. Asghari-Rad, A. Zargaran, J. W. Bae, J. Moon, J. Choe, S. Yang, J.-H. Yu and H. S. Kim: Acta Mater., 221 (2021) 117426.Article
- 13. H. Gong, K. Rafi, H. Gu, T. Starr and B. Stucker: Addit. Manuf., 1-4 (2014) 87.Article
- 14. J. M. Park, J. Choe, J. G. Kim, J. W. Bae, J. Moon, S. Yang, K. T. Kim, J.-H. Yu and H. S. Kim: Mater. Res. Lett., 8 (2020) 1.ArticlePDF
- 15. G.V. L. Nope, L.I. P.-Andrade, J. C.-Castuera, D.G. E.- Arbelaez, J. M.-Saldana and J.M. A.-Orozco: J. Manuf. Proc., 64 (2021) 1261.
- 16. J.-Y. Kim, J. Woo, Y. Sohn, J. H. Kim and K.-A. Lee: J. Powder Mater., 30 (2023) 146.Article
- 17. R. Zhao, C. Chen, W. Wang, T. Cao, S. Shuai, S. Xu, T. Hu, H. Liao, J. Wang and Z. Ren: Addit. Manuf., 51 (2022) 102605.Article
- 18. S. D. Jadhav, L. R. Goossens, Y. Kinds, B. V. Hooreweder and K. Vanmeensel: Addit. Manuf., 42 (2021) 101990.Article
- 19. S. Qu, J. Ding, J. Fu, M. Fu, B. Zhang and X. Song: Addit. Manuf., 48 (2021) 102417.Article
- 20. J. Lee, J. Choe, J. Park, J.-H. Yu, S. Kim, I. D. Jung and H. Sung: Mater. Charct., 155 (2019) 109817.Article
- 21. E. Maleki, S. Bagherifard and M. Guagliano: Int. J. Mech. Mater. Des., 18 (2022) 199.ArticlePDF
- 22. L. Scime and J. Beuth: Addit. Manuf., 24 (2018) 273.Article
- 23. T. Kim, J. G. Kim, S. Park, H. S. Kim, N. Kim, H. Ha, S.-K. Choi, C. Tucker, H. Sung and I. D. Jung: Virtual Phys. Prototyp., 18 (2022) e2124921.
- 24. S. A. Etesami, B. Fotovvati and E. Asadi: J. Alloys Compd., 895 (2022) 162618.Article
- 25. H. Park, Y. W. Kim, S. Lee, K. T. Kim, J.-H. Yu, J. G. Kim and J. M. Park: J. Powder Mater., 30 (2023) 140.Article
- 26. P. Branco, L. Torgo and R. P. Ribeiro: Proc Mach Learn Res., 74 (2017) 36.
- 27. Z. Wu, M. Asherloo, R. Jiang, M. H. Delpazir, N. Sivakumar, M. Paliwal, J. Capone, B. Gould, A. Rollett and A. Mostafaei: Addit. Manuf., 47 (2021) 102323.Article
- 28. Q. Luo, L. Yin, T. W. Simpson and A. M. Beese: Addit. Manuf., 56 (2022) 102915.
References
Figure & Data
References
Citations
Citations to this article as recorded by 
- Data-Driven analysis relates mechanical properties to pore morphology in laser powder bed fusion
Jaemin Wang, Seungyeon Lee, Yeon Woo Kim, Kyung Tae Kim, Jeong Min Park, Dierk Raabe
Acta Materialia.2026; 304: 121751. CrossRef - From physics to intelligence: a review of AI-driven modeling strategies in laser direct energy deposition additive manufacturing
Seyedeh Fatemeh Nabavi, Saeid Nahavandi, Hamid Garmestani
Optics & Laser Technology.2026; 199: 114946. CrossRef - Progresses and Challenges in Additive Manufacturing of Bulk Metallic Glasses
Md Mahbubur Rahman, Raju Ahammad, Asif Karim Neon, Mukitur Rhaman, Md Jonaet Ansari, Md Nizam Uddin, Md Mainul Islam, Muhammad Altaf Nazir
Journal of Manufacturing and Materials Processing.2026; 10(4): 121. CrossRef - Microstructure, Magnetic Properties, and Performance of Fe-6.5Si Soft Magnetic Core Produced by Laser Powder Bed Fusion
Ji Sang Yoon, Yeon Woo Kim, Gyu Hyun Park, Youk Jin Kim, Sang Heon Lee, Jeong Seok Kim, Sung Ho Yu, Jeong Min Park
Journal of Powder Materials.2026; 33(3): 177. CrossRef - Effect of Support Structure on Residual Stress Distribution in Ti-6Al-4V Alloy Fabricated by Laser Powder Bed Fusion
Seungyeon Lee, Haeum Park, Min Jae Baek, Dong Jun Lee, Jae Wung Bae, Ji-Hun Yu, Jeong Min Park
Journal of Powder Materials.2025; 32(3): 244. CrossRef - Automated segmentation and analysis of microscopy images of laser powder bed fusion melt tracks
Aagam Shah, Reimar Weissbach, David A. Griggs, A. John Hart, Elif Ertekin, Sameh Tawfick
Journal of Manufacturing Processes.2025; 154: 61. CrossRef - Coefficient of Thermal Expansion of AlSi10Mg, 316L Stainless Steel and Ti6Al4V Alloys Made with Laser Powder Bed Fusion
Selami Emanet, Edem Honu, Kekeli Agbewornu, Evelyn Quansah, Congyuan Zeng, Patrick Mensah
Materials.2025; 18(19): 4468. CrossRef - Adaptive slicing for increased productivity of metal laser powder bed fusion
Lars Vanmunster, Louca R. Goossens, Laurent Sergeant, Brecht Van Hooreweder, Bey Vrancken
Additive Manufacturing.2025; 112: 105000. CrossRef
 ePub Link
 Cite this Article


Data-driven Approach to Explore the Contribution of Process Parameters for Laser Powder Bed Fusion of a Ti-6Al-4V Alloy


Fig. 1. (a) Printing strategy to produce the samples, and (b) an optical photograph of the as-printed samples.
Fig. 2. Flow chart of the overall process of constructing machine learning models for laser powder bed fusion (LPBF)-processed Ti alloys.
Fig. 3. Relative density as a function of laser scan speed of the (a) Gr. 5 and (b) Gr. 23 Ti alloys printed at different laser power levels.
Fig. 4. Optical microscopy images for the lateral surface of the Gr. 23 Ti alloys printed by laser powder bed fusion (LPBF) at different laser powers and scan speeds.
Fig. 5. Optical microscopy images presenting (a) lack of fusion defects in a sample printed at a low volumetric energy density (VED) and (b) gas pores in a sample printed at a high VED.
Fig. 6. Relative density as a function of volumetric energy density (VED) for the (a) Gr. 5 and (b) Gr. 23 Ti alloys printed by laser powder bed fusion (LPBF).
Fig. 7. Volumetric energy density (VED) contour lines overlaid on relative density maps of the (a) Gr. 5 and (b) Gr. 23 Ti alloys printed by laser powder bed fusion (LPBF) at different laser powers and scan speeds.
Fig. 8. (a) Summary mean |SHAP value| plot and (b) distribution of SHAP values of processing variables based on different models for the Gr. 23 alloy.
Fig. 9. (a) Summary mean |SHAP value| plot and (b) distribution of SHAP values of processing variables based on different models for the Gr. 5 alloy.
Fig. 1.
Fig. 2.
Fig. 3.
Fig. 4.
Fig. 5.
Fig. 6.
Fig. 7.
Fig. 8.
Fig. 9.
Data-driven Approach to Explore the Contribution of Process Parameters for Laser Powder Bed Fusion of a Ti-6Al-4V Alloy
| Model | Parameters |
|---|---|
| ANN | • Network structure: 3 hidden layers with 16, 16, and 4 nodes |
| • Activation function: Swish activation | |
| • Dropout layer: Dropout of 10% after first and second hidden layers | |
| SVR | • Regularization parameter: 150.0 |
| • Margin (epsilon): 0.1 | |
| • Kernel: Radial basis function | |
| GPR | • Noise (alpha): variance/50 |
| • Kernel: Matérn 5/2 multiplied by a constant kernel | |
| AdaBoost | • Number of estimators: 8 |
| • Base estimator: Decision tree with maximum depth of 6 | |
| RF | • Number of estimators: 8 |
| • Maximum depth: 6 |
| ANN | GPR | AdaBoost | SVR | RF | |
|---|---|---|---|---|---|
| Maximum relative error (%) | 1.66 | 0.73 | 1.07 | 4.09 | 3.51 |
| Average relative error (%) | 0.31 | 0.15 | 0.18 | 0.72 | 0.49 |
| R2 score | 0.98 | 0.99 | 0.99 | 0.88 | 0.93 |
| ANN | GPR | AdaBoost | SVR | RF | |
|---|---|---|---|---|---|
| Maximum relative error (%) | 2.20 | 1.30 | 2.26 | 1.47 | 1.44 |
| Average relative error (%) | 0.22 | 0.27 | 0.25 | 0.39 | 0.28 |
| R2 score | 0.94 | 0.90 | 0.85 | 0.83 | 0.88 |
Table 1. Parameters used to train each model
ANN, artificial neural network; SVR, support vector regression; GPR, Gaussian process regression, AdaBoost, adaptive boosting; RF, random forest.
Table 2. Performance of each model evaluated using test data for the Gr. 23 Ti alloy
Table 3. Performance of each model evaluated using test data for the Gr. 5 Ti alloy
Table 1.
Table 2.
Table 3.
TOP
