
Articles
- Page Path
- HOME > J Powder Mater > Volume 31(3); 2024 > Article
-
Research Article
- Characterization of the Manufacturing Process and Mechanical Properties of CoCrFeMnNi High-Entropy Alloys via Metal Injection Molding and Hot Isostatic Pressing
- Eun Seong Kim1, Jae Man Park2, Do Won Lee1, Hyojeong Ha1, Jungho Choe1,3, Jaemin Wang1, Seong Jin Park2, Byeong-Joo Lee1, Hyoung Seop Kim1,4,5,6,*
-
Journal of Powder Materials 2024;31(3):243-254.
DOI: https://doi.org/10.4150/jpm.2024.00059
Published online: June 27, 2024
1Department of Materials Science and Engineering, Pohang University of Science and Technology (POSTECH), Pohang 37673, Republic of Korea
2Department of mechanical Engineering, Pohang University of Science and Technology (POSTECH), Pohang 37673, Republic of Korea
3Nano Materials Research Division, Korea Institute of Materials Science (KIMS), Changwon, Republic of Korea
4Graduate Institute of Ferrous & Eco Materials Technology (GIFT), Pohang University of Science and Technology (POSTECH), Pohang 37673, Republic of Korea
5Institute for Convergence Research and Education in Advanced Technology, Yonsei University, Seoul, 03722, Republic of Korea
6Advanced Institute for Materials Research (WPI-AIMR), Tohoku University, Sendai 980-8577, Japan
- *Corresponding Author: Hyoung Seop Kim, TEL: +82-54-279-2150, E-mail: hskim@postech.ac.kr
- - Eun Seong Kim, Do Won Lee, Hyo Jeong Ha: Student, Jae Man Park Jungho Choe, Jaemin Wang: Researcher, Seong Jin Park, Byeong-Joo Lee, Hyoung Seop Kim: Professor
© The Korean Powder Metallurgy & Materials Institute
This is an Open Access article distributed under the terms of the Creative Commons Attribution Non-Commercial License (http://creativecommons.org/licenses/by-nc/4.0/) which permits unrestricted non-commercial use, distribution, and reproduction in any medium, provided the original work is properly cited.
- 3,034 Views
- 69 Download
- 1 Crossref
Abstract
- High-entropy alloys (HEAs) have been reported to have better properties than conventional materials; however, they are more expensive due to the high cost of their main components. Therefore, research is needed to reduce manufacturing costs. In this study, CoCrFeMnNi HEAs were prepared using metal injection molding (MIM), which is a powder metallurgy process that involves less material waste than machining process. Although the MIM-processed samples were in the face-centered cubic (FCC) phase, porosity remained after sintering at 1200°C, 1250°C, and 1275°C. In this study, the hot isostatic pressing (HIP) process, which considers both temperature (1150°C) and pressure (150 MPa), was adopted to improve the quality of the MIM samples. Although the hardness of the HIP-treated samples decreased slightly and the Mn composition was significantly reduced, the process effectively eliminated many pores that remained after the 1275°C MIM process. The HIP process can improve the quality of the alloy.
- The hydrogen economy requires the development of materials and processes that exhibit diverse functional properties [1, 2]. High-entropy alloys (HEAs), which have been reported to have better cryogenic properties [3, 4], corrosion resistance [5], and hydrogen embrittlement resistance than commercial materials [6], have attracted attention as candidates to replace existing commercial materials. HEAs are alloys that have changed the concept of conventional alloy design and are single solid-solution phase alloys composed of five or more main elements with maximized compositional entropy [2,3]. Among them, CoCrFeMnNi HEAs in face-centered cubic (FCC) phase with low stacking fault energy (SFE) have been extensively studied in mechanical property as well as in novel process applications [7-9].
- However, because CoCrFeMnNi HEAs are relatively expensive in terms of their chemical composition compared to conventional commercial alloys, research is also being conducted to reduce the cost by saving materials or reducing the processing procedure to help commercialize them. Processes reported for the fabrication of CoCrFeMnNi HEAs include casting and forging [10], direct energy deposition [9, 11, 12], powder bed fusion [13, 14], binder jetting additive manufacturing [15], high pressure torsion [16], and metal injection molding [17, 18]. In particular, powder metallurgy, especially the sintering process, has the advantage of less material loss and excellent accuracy compared to other processes, making it applicable for mass production [19]. Among the various processes, we focused on 3D shape manufacturing using the feedstock of powders and binders. Similar to the metal additive manufacturing (MAM) process, which produces near-net shaped 3D parts, it is a highly industrial process that eliminates most of the machining procedures, resulting in low material loss [20]. There are two processes for manufacturing 3D-shaped parts using binders with very little loss of powder materials: the binder jetting (BJ) additive manufacturing process [15], which involves layer-by-layer deposition, and the metal injection molding (MIM) process [17-20], which involves injection into a mold in the shape of the parts.
- The MIM process is well suited for the mass production of precision parts because it uses a feedstock mix of powder and binder, which is injected into a mold of the target part geometry, followed by debinding and sintering to produce the final parts [20]. In other words, MIM has the advantage of manufacturing precise parts with little material waste, which is attractive because it can reduce the production costs of expensive material processes. Kim et al. [18] fabricated CoCrFeMnNi HEA by MIM process and analyzed their microstructure. However, the MIM process alone makes it difficult to achieve high relative densities due to the residual pores in the part. High porosity and low density are widely recognized to degrade the mechanical properties of parts and are the main reasons for achieving less than expected properties [21]. This means that the MIM process alone leaves pores, which must be removed by an additional process. In the literature, defects in alloys manufactured by powder metallurgy have been effectively removed using hot isostatic pressing (HIP) [22]. HIP process can be used to increase the density and reduce the porosity of HEA fabricated by the MIM process.
- In this study, we prepared HEA using the MIM process and attempted to improve their relative densities and porosities using the HIP process. We also investigated the changes in hardness and microstructure under different process conditions.
1. Introduction
- 2.1. Powder materials
- The CoCrFeMnNi HEA powders used in this study were spherical powders prepared via gas atomization (MK Inc., Republic of Korea). The morphology and composition of the powders before the MIM process were measured using the field emission scanning electron microscope (SEM, XL-30S FEG, FEI Co., 5 kV) with the energy dispersive spectrometer (EDS). The particle size distribution (PSD) of the CoCrFeMnNi HEA powders was measured by a laser particle size analyzer (Mastersizer 3000, Malvern), and the median D50 of the powdered material was 86.2 μm (Fig. 1a). The spherical powders were mixed with each element in approximately equal fractions (Fig. 1b).
- 2.2. MIM process
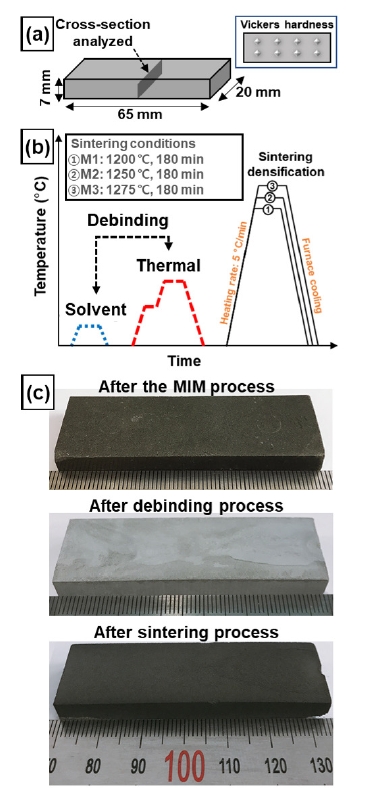
- The feedstock was prepared by mixing the binder and powders. Fig. 2a show that specimens with a width of 20 mm, length of 64 mm, and thickness of 7 mm were injected using a metal injection molding machine (MIM, Sodick, TR30EH). Thermal debinding was performed after solvent debinding to remove the binder. The samples were then sintered at three conditions of 1200 °C, 1250 °C, and 1275 °C. These three conditions were named M1, M2, and M3, respectively (Fig. 2b).
- 2.3. HIP process
- In order to reduce the porosity of the MIM-processed samples, the HIP process was performed at 1150 °C for 4 h under the pressure of 150 MPa (Fig. 3a). Considering the phase diagram simulated by Thermo-Calc software (Database: TCFE2000 and its upgraded version [23-28]), the HIP process conditions were determined to be the temperature at which the FCC phase matrix forms (Fig. 3b). The HIP-treated M1, M2, and M3 were named H1, H2, and H3, respectively (Fig. 3a). In addition, M1, M2, M3, H1, H2, and H3 were all sintered at high temperatures and cooled gradually in the furnace to avoid thermally induced residual stresses and distortions.
- 2.4. Microstructure characterization & mechanical testing
- To analyze the cross-sectional microstructures of the MIM- and HIP-treated samples, SiC sheets of 400, 600, 800, and 1200 grit were used for mechanical polishing, and colloidal silica solution was used for mechanochemical polishing. The cross-sectional morphology was obtained using optical microscopy (OM, BX51M, Olympus, magnification: x50). In addition, SEM was used to analyze the electron backscatter diffraction (EBSD, XL30S, Philips, step size: 1.5 µm, beam: 20 kV) and EDS. The density was measured by Archimedes’ principle density balance (XP 205, Mettler Toledo, repeated five times). The mechanical properties were tested using the Vickers hardness machine (FM-700, Future Tech, load: 100 gf, dwell time: 10 s). Vickers hardness was measured eight times at intervals of 2 mm (Fig. 2a show the cross-section view and schematic).
2. Experimental
- 3.1. Optical microscopy analysis
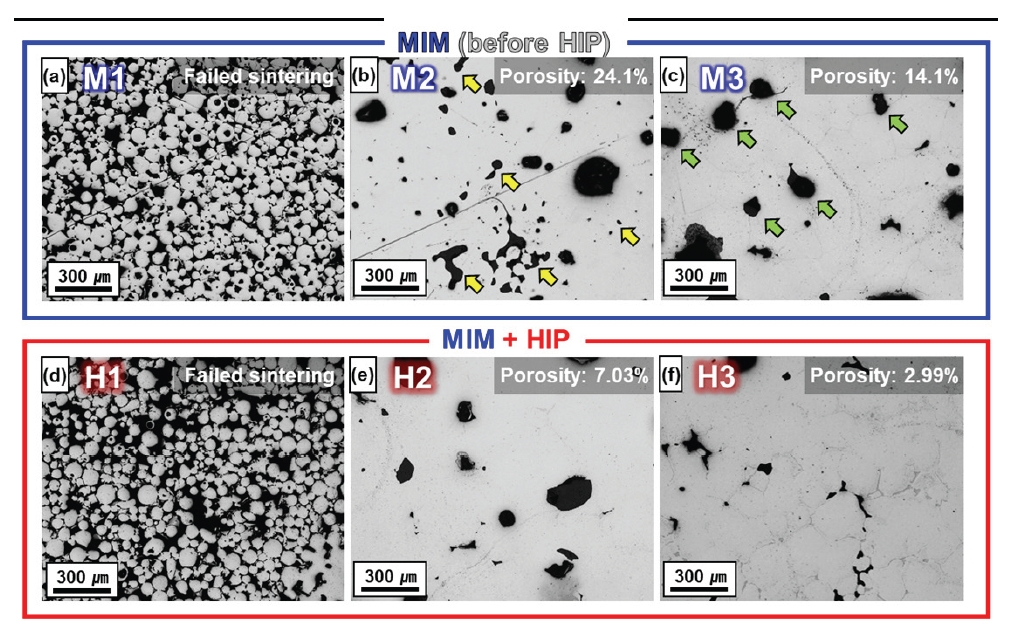
- Fig. 4 shows the images of the pores observed by OM measurements. The OM analysis of the cross-section shows that the MIM treatment alone on M1 resulted in poor sintering, and features of the powders were observed (Fig. 4a). Because M1 is barely sintered and not in a shape that can be pressurized sintered, the additional HIP treatment has little effect on the pores or morphology (Fig. 4d). In other words, M1 sintered at 1200 °C could not be improved by the HIP. In contrast to M1, for M2 sintered at 1200 °C (Fig. 4b), the pore features formed during sintering were observed (yellow arrows). Fig. 4e shows H2 after HIP treatment of M2, where many of the small pores (yellow arrows) in M2 were significantly removed. Relatively large pores remained, but smaller ones were closed or consolidated into smaller pores (Fig. 4b,e). On the other hand, in contrast to M2, M3 sintered at 1275 °C does not show any relatively small-sized pores (Fig. 4c). Figure 4f shows H3 after the HIP treatment, and many of the pores (green arrows) in M3 were noticeably removed. Consequently, the large pores in M2 were significantly removed and H3 became closed pores with irregular shapes.
- 3.2. Microhardness with the grain size
- Fig. 5 shows the porosity analyzed by OM and the density measured by Archimedes’ method before and after HIP treatment for relative comparison analysis. Considering the porosity and relative density (Fig. 4,5), M2 has a porosity of 24.1% and a relative density of 85.2% (6.778 g/cm3), while H2 has a porosity of 7.03% and a relative density of 89.1% (7.09 g/cm3). Fig. 4b,e intuitively shows that the density increased with porosity improvement (the yellow arrow that disappeared in M2 corresponds to the porosity that disappeared in H2). Similarly, M3 had a porosity of 14.1% and a relative density of 87.8% (6.989 g/cm3), whereas H3 had a porosity of 2.99% and a relative density of 90.5% (7.201 g/cm3). Fig. 4c,f show that the pores in M2 (green arrows) are significantly removed in H3. The porosity of M3 was significantly reduced, indicating that the density of H3 was significantly improved.
- Fig. 5 show the hardeness measured by Vickers Hardness test. Because enhanced density and porosity cannot explain the reduction in hardness, another major microstructural factor, grain size, must also be considered [21, 29]. Fig. 6i-l show the kernel average misorientation (KAM) maps estimated using EBSD. The KAM value is an effective way to show the tendency of the dislocation-based strain distribution [9,30-32]. Because M2 and M3, as well as H2 and H3, were processed at high temperatures and cooled gradually, the average KAM values did not differ significantly. This KAM analysis allowed us to analyze the effect of grain size and grain boundaries on hardness more clearly, without considering the main microstructural factors of dislocations.
- Fig. 5 shows the change in hardness before and after the HIP treatment. Although the density and porosity of M2 improved in H2, the hardness decreased slightly from 174±14 Hv to 162±11 Hv. According to the Hall-Petch relationship [33, 34], the relationship between the average grain size and yield strength can be found, and according to the Tabor relationship [33, 35], the relationship between yield strength and hardness can be found. The relationship expression that considers the above two relationships is summarized in Eq. (1).
- Where σy is the yield strength, σ0 is the material constant for dislocation movement, ky is the strengthening coefficient, and d is the average grain size. In general, in metallic materials, grain boundaries typically function as fixed points and obstruct the propagation of dislocations [36]. The increase in grain size equals the decrease in grain boundary fraction, and we can see that grain size and hardness are inversely proportional, meaning that the increase in grain size from 123 μm to 152 μm due to the HIP treatment is likely responsible for the decrease in hardness. Similarly, the hardness of M3 was 230±11 Hv, which was slightly reduced to 216±14 Hv in H3 after HIP treatment. Considering Equation 1 together, the average grain size of H3 increased from 168 μm to 184 μm with the HIP treatment, which contributed to the decreased hardness.
- 3.3. Microstructure and chemical composition
- For microstructure analysis, IQ-inverse pole figure (IPF) maps were obtained by EBSD based on the (100) crystal plane (Fig. 6a-d). The color difference in the IPF map indicates which crystal direction each grain is oriented, and is a useful analysis method that can effectively distinguish the texture of the metallic materials [9, 18, 31, 37]. Because neither the MIM sintering nor the HIP treatment induced anisotropy, the grains were grown as homogeneously textured, equiaxed grains that were not oriented.
- The IQ-phase maps show that the FCC phase is organized in the matrix for all conditions before and after HIP process (Fig. 6e,h). Considering the thermodynamic equilibrium diagram (Fig. 3b), it is possible to have B2 and sigma phases besides the FCC phase, as furnace cooling will unavoidably pass through temperatures with different stable phases [17, 30]. However, during the sintering process, the elements segregated towards the grain boundaries have a different composition from that of the initial powder, which can also lead to different phases [38]. The composition analyzed by EDS shows that in H2, M3, and H3, the elements Cr, Ni, and Mn have inhomogeneous distributions (Fig. 7). However, considering the Mn content of 19.9 at.% in the initial powders, M2 and M3 fabricated by the MIM process showed the decrease in Mn content of about 3-4 at.%, while H2 and H3, which were subjected to HIP treatment, showed the additional decrease in Mn content of about 8-10 at.%. The reduced Mn content can be attributed to two factors [39]. First, the high-temperature sintering in the vacuum atmosphere in MIM process resulted in more evaporation of Mn, which has the relatively low melting point compared to other elements (Co, Cr, Fe, Ni), and the HIP treatment in an Ar atmosphere with accompanying pressure accelerated the evaporation of Mn. Second, the reduction of Mn is assumed to be formed due to the inevitable oxidation during the MIM and HIP processes. Also, Fig. 7, the distribution of O is consistent with that of Mn. Manganese oxide is mainly observed around the voids, and the Mn content of the matrix decreased in proportion to the manganese oxide formed.
- The IQ-phase maps show that the FCC phase was organized in the matrix for all conditions before and after the HIP process (Fig. 6e,h). Considering the thermodynamic equilibrium phase diagram (Fig. 3b), it is possible to have B2 and sigma phases in addition to the FCC phase because furnace cooling will inevitably pass through temperatures with different phases [17, 30]. However, during the sintering process, the elements segregated towards the grain boundaries have a different composition from that of the initial powder, which can also lead to different phases [8, 38]. For H2, M3, and H3, the compositional distributions analyzed by EDS show the inhomogeneity of Cr, Ni, and Mn along the grain boundaries (Fig. 7). However, considering the Mn content of 19.9 at.% in the initial powders, M2 and M3 fabricated by the MIM process showed a decrease in Mn content of approximately 3-4 %p, while H2 and H3, which were subjected to HIP treatment, showed an additional decrease in Mn content of approximately 8-10 %p. The reduced Mn content could be attributed to two factors [39]. First, high-temperature sintering in the vacuum atmosphere in the MIM process resulted in more evaporation of Mn, which has a relatively low melting point compared to other elements (Co, Cr, Fe, and Ni), and the HIP treatment in an Ar atmosphere with accompanying pressure accelerated the evaporation of Mn. Second, the reduction of Mn is assumed to occur owing to the inevitable oxidation during the MIM and HIP processes. Plus, Fig. 7 shows that the distribution of O was consistent with that of Mn. Manganese oxide was mainly observed around the voids, and the Mn content of the matrix decreased in proportion to the manganese oxide formed.
- In addition, HEAs have a low SFE, an alloy in which twinning is activated by annealing or deformation [40]. The twin boundary fraction (TBF) increased to 22.7% in M2 and 27.7% in H2 (yellow boundaries in Fig. 6e,f). Furthermore, Ni and Mn, the main elements in CoCrFeMnNi HEAs, are typical FCC phase-stabilizing elements, and it can be inferred that the reduced Mn induces the matrix to be less phase-stabilized to FCC, further enabling twinning. On the other hand, in contrast to H2, TBF decreased slightly in H3 to 15.1% (M3) and 12.5% (H3) (Fig. 6g,h).
- Considering the average chemical composition (Fig. 7), this is not convincing because the trend of the global chemical composition changed by the HIP process for both H2 and H3 is similar. However, the Co-Cr-Fe-Mn-Ni system is an alloy in which phases other than FCC appear when the composition of each element varies [40]. In other words, the chemical composition is strongly related to the stability of either the FCC or BCC phases.
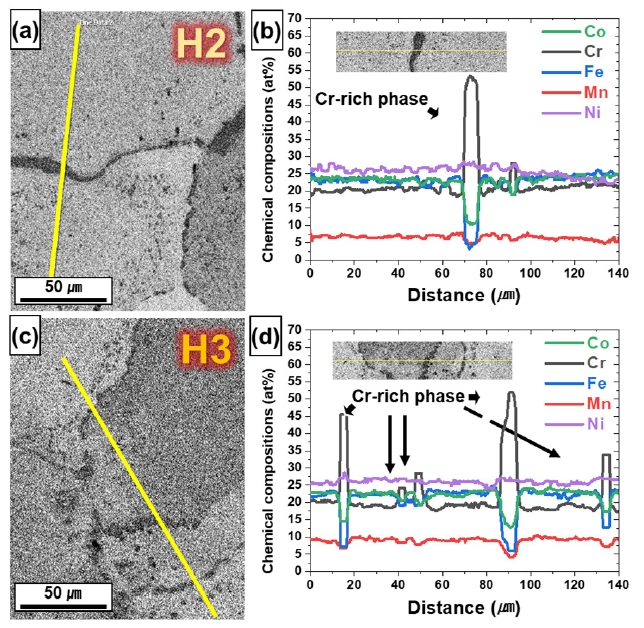
- Fig. 8 shows the SEM-EDS line profile results obtained near the grain boundary, and the chemical composition distributions of H2 and H3 were different. Both the HIP-treated H2 and H3 precipitated Cr-rich phases at the grain boundaries. The Cr-rich phase formed by heat treatment is the BCC phase near the grain boundary [17, 41], and the precipitated BCC phase is more distributed in H3 than in H2. In other words, Cr functions as a BCC stabilizer [42, 43], which increases the FCC stability of the matrix. Table 1 shows the average chemical composition of the matrix region as measured by EDS, showing that Cr in the matrix is more depleted in H3.
- Thermodynamically simulated Gibbs free energy (G) with matrix composition also supports this evidence (Software: Thermo-Calc, Database: TCFE2000 and its upgraded version [23-28]). G is a useful means of expressing the phase stability, where the phase with the lowest negative value can be described as the stable phase [41, 42]. Fig. 9 shows the results of G for the phase stability simulated at 150 MPa, mimicking the HIP process conditions. For comparative analysis, we reconstructed the simulated stability of each phase in terms of G difference (△G) in Eq. (1,2).
- A positive △G is indicates that the FCC phase is stable and a negative △G indicates that the FCC phase unstable. In other words, when the energy barrier is overcome (△G = 0), it becomes phase transformation. At the HIP treated temperature (1150 °C), △G (FCC→BCC) of H3 is 1686 J/mol, which is greater than H2 (1563 J/mol) (Fig. 9a, Table 1). Similarly, △G (FCC→HCP) shows the same trend (H3: 2349, H2: 2168) as △G (FCC→BCC) (Fig. 9b, Table 1). Moreover, H3 was greater than H2 at all temperatures. Taken together, these results suggest that although it forms a single FCC phase at elevated temperatures and changes to the metastable FCC phase during cooling to room temperature (RT), H3 is more stable than H2 at all temperatures, which is consistent with the trend of the TBF of H2 (27.7 %) being greater than that of H3 (12.5 %), suggesting that H3, which is more depleted in Cr than H2, is a more stable FCC phase than H2.
- This means that the TBF difference is inferred to be influenced more by the MIM processing temperature. The difference in TBF due to HIP treatment was ~4%p (M2 and H2) and ~3%p (M3 and H3), while the difference in TBF due to the difference in sintering temperature of the MIMs was ~7%p (M2 and M3). Considering all the SEM-EDS images (Fig. 7), the influence of the secondary phases cannot be ruled out. The annealed twins of HEA in the FCC matrix can be attributed not only to the chemical composition (distribution changed by Mn evaporation during HIP treatment), but also to the temperature influence of the MIM process (difference between M2 and M3, matrix composition, and BCC phase).
- In this study, the MIM-processed HEA prepared at different temperatures were further subjected to the HIP process to improve the porosity, and the hardness and microstructure differences of the MIM samples before and after HIP treatment were analyzed. In the future, we will perform thermodynamic calculations considering temperature and pressure to propose further improved process conditions and fabricate improved FCC single-phase HEA components to analyze the influence of the microstructure on the mechanical deformation behavior.
3. Results and Discussion
- In this study, CoCrFeMnNi HEA samples were fabricated by metal injection molding (MIM) process and hot isostatic pressing (HIP) treatment. The hardness, density, porosity, and microstructure of the HIP-treated HEA were investigated and the following conclusions were obtained:
- 1) After the HIP treatment, the average grain size increased and the hardness decreased, but the porosity was significantly reduced and the density increased, which improved the quality.
- 2) Both MIM and HIP processes resulted in Mn composition changes; the composition of Mn decreased slightly after the MIM process and decreased significantly after the HIP process. Manganese oxide was observed in all samples during cooling of the heat treatment, and precipitation on Cr-rich BCC could not be avoided.
- 3) The annealing twin changes slightly (3-4%p) after HIP treatment, but a more dominant change (8-10%p) can be seen with the difference in sintering temperature of the MIMs, which is due to the change in composition during the process and the influence of the precipitation phases.
- In order to contribute to the manufacturing of commercial HEA components, future work should not only study the microstructure under different process conditions, but also the effect of microstructure on the mechanical deformation behavior.
4. Conclusion
-
Conflict of Interest Declaration
The authors declare no competing financial interests or personal relationships.
-
Author Information and Contribution
Eun Seong Kim, Do Won Lee, Hyo Jeong Ha: Student, Jae Man Park Jungho Choe, Jaemin Wang: Researcher, Seong Jin Park, Byeong-Joo Lee, Hyoung Seop Kim: Professor
-
Acknowledgement
This work was supported by the National Research Foundation (NRF) of the Republic of Korea (2021R1A2C3006662 and 2022R1A5A1030054). Eun Seong Kim is also supported by Basic Science Research Program through the National Research Foundation of Korea (NRF) funded by the Ministry of Education (2022R1A6A3A13073830).
Article information


- 1. M. Yue, H. Lambert, E. Pahon, R. Roche, S. Jemei and D. Hissel: Renew. Sustain. Energy Rev., 146 (2021) 111180.Article
- 2. B. Gludovatz, A. Hohenwarter, D. Catoor, E. H. Chang, E. P. George and R. O. Ritchie: Science., 6201 (2014) 1153.
- 3. E. P. George, D. Raabe and R. O. Ritchie: Nat. Rev. Mater., 4 (2019) 515.ArticlePDF
- 4. H. Luo, Z. Li, W. Lu, D. Ponge and D. Raabe: Corros. Sci., 136 (2018) 403.Article
- 5. Y. Fu, J. Li, H. Luo, C. Du and X. Li: J. Mater. Sci. Technol., 80 (2021) 217.Article
- 6. Z. Pu, Y. Chen and L. H. Dai: Mater. Sci. Eng. A., 736 (2018) 156.Article
- 7. R. B. Mane, R. Y and B. B. Panigrahi: Powder Metallurgy., 61 (2018) 131.Article
- 8. F. Otto, A. Dlouhý, K. G. Pradeep, M. Kuběnová, D. Raabe, G. Eggeler and E. P. George: Acta Mater., 112 (2016) 40.Article
- 9. E. S. Kim, K. R. Ramkumar, G. M. Karthik, S. G. Jeong, S. Y. Ahn, P. Sathiyamoorthi, H. Park, Y. -U. Heo and H. S. Kim: J. Alloys Compd., 942 (2023) 169062.Article
- 10. J. H. Kim, K. R. Lim, J. W. Won, Y. S. Na and H.-S. Kim: Mater. Sci. Eng. A., 712 (2018) 108.Article
- 11. G. H. Gu, E. S. Kim, H. Kwon, S. Son, R. E. Kim, T. K. Oh and H. S. Kim: Mater. Sci. Eng. A., 836 (2022) 142718.Article
- 12. S. Y. Ahn, D. G. Kim, J. A. Lee, E. S. Kim, S. G. Jeong, R. E. Kim, S.-J. Hong, P. Quang, S. Lee and H. S. Kim: J. Alloys Compd., 960 (2023) 170602.Article
- 13. A. Piglione, B. Dovgyy, C. Liu, C. M. Gourlay, P. A. Hooper and M. S. Pham: Mater. Lett., 224 (2018) 22.Article
- 14. G. M. Karthik, Y. Kim, E. S. Kim, A. Zargaran, P. Sathiyamoorthi, J. M. Park, S. G. Jeong, G. H. Gu, A. Amanov, T. Ungar and H. S. Kim: Addit. Manuf., 59 (2022) 103131.Article
- 15. Z. Xu, Z. Zhu, P. Wang, G. K. Meenashisundaram, S. M. L. Nai and J. Wei: Addit. Manuf., 35 (2020) 101441.Article
- 16. G. M. Karthik, P. Asghari-rad, P. Sathiyamoorthi, A. Zargaran, E. S. Kim, T. S. Kim and H. S. Kim: Scr. Mater., 195 (2021) 113722.Article
- 17. Y. Zhang, T. Bian, X. Shen, Z. Wang, S. Ye, S. Feng, K. Yu, C. Ding and P. Yu: J. Alloys Compd., 868 (2021) 158711.Article
- 18. E. S. Kim, J. M. Park, J. S. Lee, J. Choe, S. Y. Ahn, S. G. Jeong, D. W. Lee, S. J. Park and H. S. Kim: J. Powder Mater., 30 (2023) 1.Article
- 19. A. O. Araoyinbo, F. A. Ishola, E. Y. Salawu, M. B. Biodun and A. U. Samuel: AIP Conf. Proc., 2437 (2022) 020153.Article
- 20. S. V. Atre, T. J. Weaver and R. M. German: Injection Molding of Metals and Ceramics., SAE Technical Paper (1998) 982417.
- 21. F. Ternero, L. G. Rosa, P. Urban, J. M. Montes and F. G. Cuevas: Metals., 11 (2021) 730.Article
- 22. D. F. Heaney, Handbook of metal injection molding, Woodhead Publishing, (2018).
- 23. J. O. Andersson, T. Helander, L. Höglund, P. Shi and B. Sundman: Calphad., 26 (2002) 273.Article
- 24. B.-J. Lee and B. Sundman: TCFE2000: The Thermo-Calc Steels Database, upgraded by B.-J. Lee., KTH, Stockholm (1999.
- 25. W.-M. Choi, Y. H. Jo, D. G. Kim, S. S. Sohn, S. Lee and B.-J. Lee: J. Phase Equilibria Diffus., 39 (2018) 694.ArticlePDF
- 26. W.-M. Choi, Y. H. Jo, D. G. Kim, S. S. Sohn, S. Lee and B.-J. Lee: Calphad., 66 (2019) 101624.Article
- 27. H.-S. Do, W.-M. Choi and B.-J. Lee: J. Mater. Sci., 57 (2022) 1373.ArticlePDF
- 28. H.-S. Do, T. J. Jang, K. J. Kim, S. S. Sohn and B.-J. Lee: Mater. Sci. Eng. A., 859 (2022) 144220.Article
- 29. J. Čapek and D. Vojtěch: Mater. Sci. Eng. C., 43 (2014) 494.
- 30. E. S. Kim, F. Haftlang, S. Y. Ahn, G. H. Gu and H. S. Kim: J. Alloys Compd., 907 (2022) 164415.Article
- 31. G. M. Karthik, E. S. Kim, P. Sathiyamoorthi, S. G. Jeong, R. Xiong, S. H. Kang, J.-W. Cho and H. S. Kim: Addit. Manuf., 47 (2021) 102314.Article
- 32. M. J. Sagong, E. S. Kim, J. M. Park, G. M. Karthik, B.-J. Lee, J.-W. Cho, C. S. Lee, T. Nakano and H. S. Kim: Mater. Sci. Eng. A., 847 (2022) 143318.Article
- 33. E. S. Kim, F. Haftlang, S. Y. Ahn, H. Kwon, G. H. Gu and H. S. Kim: J. Mater. Sci., 57 (2022) 17967.ArticlePDF
- 34. H. Kwon, P. Asghari-Rad, J. M. Park, P. Sathiyamoorthi, J. W. Bae, J. Moon, A. Zargaran, Y. T. Choi, S. Son and H. S. Kim: Intermetallics., 135 (2021) 107212.Article
- 35. A. E. Tekkaya and K. Lange: CIRP Annals., 49 (2000) 205.Article
- 36. Z. Shen, R. H. Wagoner and W. A. T. Clark: Acta Metall., 36 (1988) 3231.Article
- 37. F. Haftlang, E. S. Kim and H. S. Kim: J. Mater. Process. Technol., 309 (2022) 117733.Article
- 38. H. Zhao, F. De Geuser, A. K. da Silva, A. Szczepaniak, D Ponge and D. Raabe: Acta Mater., 156 (2018) 318.Article
- 39. E. Hryha, E. Dudrova and L. Nyborg: Metall. Mater. Trans. A., 41 (2010) 2880.ArticlePDF
- 40. M. Vaidya, K. Guruvidyathri and B. S. Murty: J. Alloys Compd., 774 (2019) 856.Article
- 41. M. Vaidya, A. Anupam, J. Vijay Bharadwaj, C. Srivastava and B. S. Murty: J. Alloys Compd., 791 (2019) 1114.Article
- 42. K. Guruvidyathri, B. S. Murty, J. W. Yeh and K. C. Hari Kumar: J. Alloys Compd., 768 (2018) 358.Article
- 43. S. Yang, G. Liu and Y. Zhong: J. Alloys Compd., 916 (2022) 165477.Article
References
Figure & Data
References
Citations
- Review on the impact of processing routes and external factors on phase formation and tribological properties of CoCrFeMnNi HEAs
Rituraj Chandrakar, Om Prakash, Anil Kumar, Ankur Jaiswal, Manish Kumar
Emergent Materials.2026;[Epub] CrossRef
 ePub Link
 Cite this Article
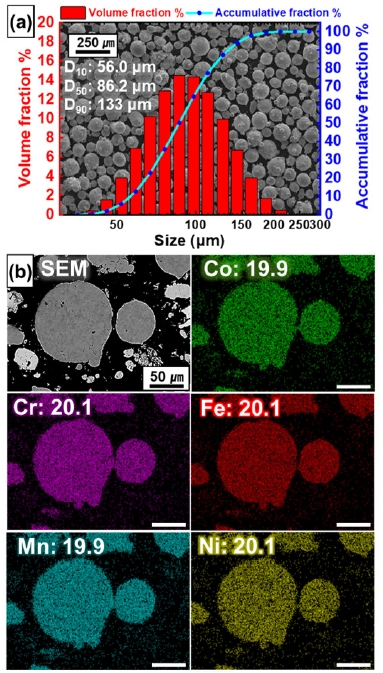

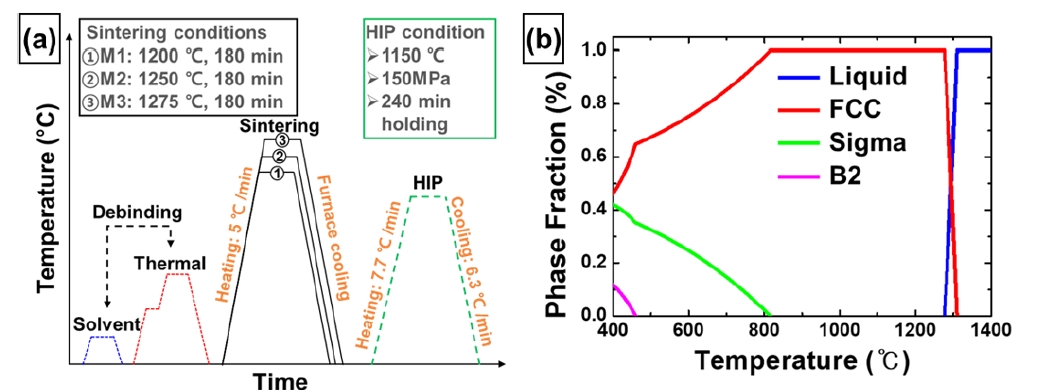

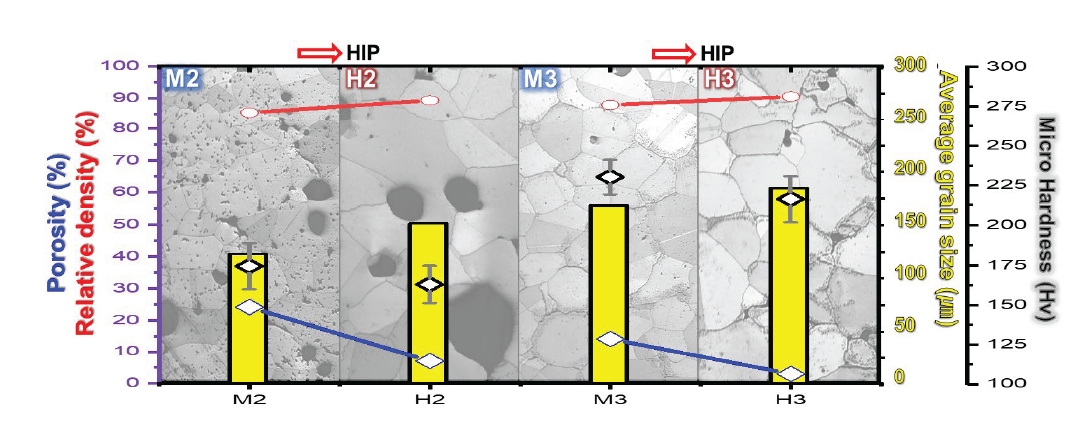
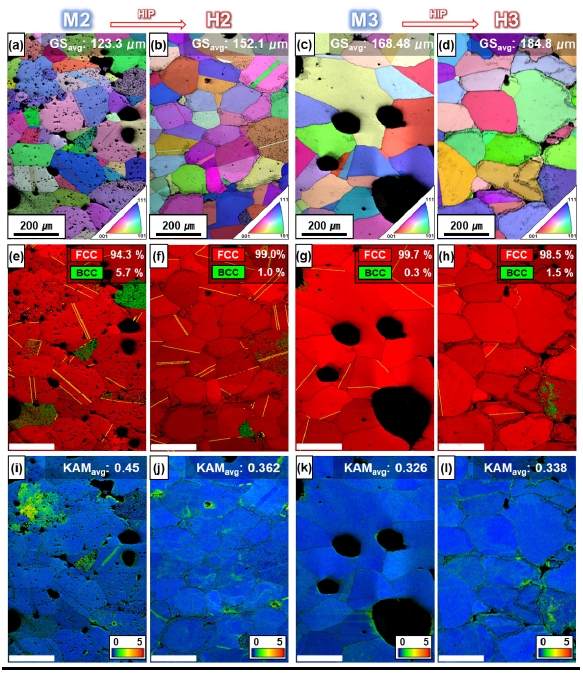
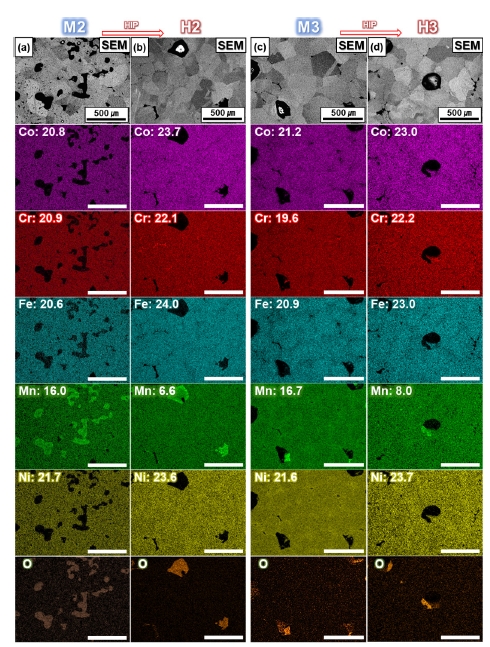


Fig. 1.
Fig. 2.
Fig. 3.
Fig. 4.
Fig. 5.
Fig. 6.
Fig. 7.
Fig. 8.
Fig. 9.
| Average chemical composition of FCC matrix (at.%) |
ΔG (J/mol) |
||||||
|---|---|---|---|---|---|---|---|
| Co | Cr | Fe | Mn | Ni | FCC to BCC | FCC to HCP | |
| Theoretical | 20.0 | 20.0 | 20.0 | 20.0 | 20.0 | 1169 | 2088 |
| H2 | 24.13 | 20.69 | 23.34 | 6.10 | 25.56 | 1563 | 2168 |
| H3 | 23.70 | 17.86 | 22.51 | 9.72 | 26.06 | 1686 | 2349 |
Table 1.
TOP
