
Articles
- Page Path
- HOME > J Powder Mater > Volume 33(2); 2026 > Article
-
Research Article
- Influence of Cobalt Content on Phase Formation and Morphology in Co-Zn-O Oxides
- Deukhyeon Nam1,2, Sungdo Yun1,2, Bo Eun Choi1,3, Chan Woong Na1, Yoon Myung1,*
-
Journal of Powder Materials 2026;33(2):104-112.
DOI: https://doi.org/10.4150/jpm.2026.00052
Published online: April 30, 2026
1Korea Institute of Industrial Technology, Dongnam Technology Application Division, Busan 46938, Republic of Korea
2Department of Materials Science and Engineering, Korea University, Seoul 02841, Republic of Korea
3Department of Materials Science and Engineering, Pusan National University, Busan 46241, Republic of Korea
- *Corresponding author: Yoon Myung E-mail: myungyoon@kitech.re.kr
© The Korean Powder Metallurgy & Materials Institute
This is an Open Access article distributed under the terms of the Creative Commons Attribution Non-Commercial License (http://creativecommons.org/licenses/by-nc/4.0/) which permits unrestricted non-commercial use, distribution, and reproduction in any medium, provided the original work is properly cited.
- 1,212 Views
- 12 Download
Abstract
- Co–Zn–O–based materials have attracted attention for applications in energy storage and catalysis. In this study, the effects of cobalt incorporation on the crystal phase and particle morphology of Co–Zn–O oxides were investigated. ZnO-based oxides were synthesized using a reflux method, and the influence of cobalt content on phase formation and morphology was systematically evaluated. As the cobalt precursor concentration increased, scanning electron microscopy–energy dispersive X-ray spectroscopy confirmed higher cobalt incorporation. This compositional variation was accompanied by changes in particle morphology, including nanoparticles, disk-like structures, and occasional rod-like features. X-ray diffraction and Raman spectroscopy showed that samples with low cobalt content retained the wurtzite ZnO phase, whereas higher cobalt concentrations led to formation of a ZnO/ZnCo2O4 composite. X-ray photoelectron spectroscopy revealed comparable binding energies among samples, while differences in peak width suggested variations in the local coordination environment of cobalt. These results indicate that cobalt content significantly influences phase composition and particle morphology in Co–Zn–O oxides synthesized under reflux conditions.
- Zinc oxide (ZnO), which is abundant and cost-effective, is a representative metal oxide semiconductor with a wide bandgap of approximately 3.3 eV at room temperature, and has been widely applied in various fields including catalysis [1], sensors [2], energy storage devices [3] and optoelectronic devices [4]. ZnO crystallizes in a thermodynamically stable wurtzite structure composed of tetrahedrally coordinated Zn2+ and O2- ions, exhibiting partial covalent bonding characteristics and sp³ hybridization [5]. These structural features impart semiconducting and piezoelectric properties. In addition, ZnO is a non-toxic material and can be synthesized through relatively simple processes, allowing facile control over crystal structure and morphology, such as nanoparticles, nanowires, and nanospheres [6, 7]. However, pristine ZnO exhibits several limitations in practical applications, including low electrical conductivity, poor light absorption due to its wide bandgap, inefficient charge separation, and a limited number of catalytic active sites [8, 9]. To overcome these limitations, transition metal doping has been widely proposed as an effective strategy to modulate the electronic structure of ZnO. In such systems, transition metal ions substitute Zn²⁺ sites within the crystal lattice. Due to their partially filled 3d orbitals and variable oxidation states, transition metal dopants can induce oxygen vacancies and lattice distortion, thereby modifying the bandgap, enhancing conductivity, improving charge transport, and increasing catalytic active sites. Consequently, these modifications can significantly enhance the performance of ZnO-based materials in photocatalysis, sensing, and detection applications. R. Elilarassi et al. [10] reported that Ni doping can tune the bandgap of ZnO, while Khanesh Kumar et al. [11] demonstrated that Fe doping improves photocatalytic performance. Among transition metals, cobalt (Co) has attracted particular attention due to its favorable electronic structure modulation and its ability to provide active sites for catalytic reactions. Co²⁺ can be oxidized to Co³⁺, resulting in changes in optical and electrical properties [12]. Furthermore, the ionic radius of Co²⁺ (0.58 Å) is comparable to that of Zn²⁺ (0.60 Å), enabling substitution with minimal lattice distortion while effectively tuning optical, magnetic, and electrical properties [13]. Moreover, the multiple oxidation states of cobalt play a crucial role in the formation of spinel oxide structures. A representative example is Co₃O₄, which exhibits a normal spinel structure in which Co²⁺ occupies tetrahedral sites and Co³⁺ occupies octahedral sites. When cobalt is doped into ZnO, Co²⁺ initially substitutes Zn²⁺ sites; however, as the cobalt concentration increases, a spinel ZnCo₂O₄ phase may form, in which Zn²⁺ occupies tetrahedral sites and Co³⁺ occupies octahedral sites [14]. As a result, a heterostructure composed of ZnO and ZnCo₂O₄ can be formed. Such heterostructures can facilitate charge transfer and enhance catalytic activity. Therefore, cobalt ions, owing to their multiple oxidation states, can be effectively utilized in various electrochemical applications, including the oxygen evolution reaction (OER) [15], gas sensing [16], and photocatalysis [17]. In this study, ZnCo glycolate precursors were synthesized via a reflux system, followed by heat treatment at 350 °C to obtain cobalt-doped ZnO and ZnO/ZnCo2O4 composites. By varying the Zn precursor concentration, phase transformation and morphological evolution were systematically investigated using X-ray diffraction (XRD) and scanning electron microscopy (SEM).
1. Introduction
- 2-1. Materials and Synthesis
- The precursor of ZnO, Zn glycolate, was synthesized using a reflux method. First, 50 mL of ethylene glycol (99.5%, Samchun) was added to a 100 mL round-bottom flask, followed by the addition of zinc acetate dihydrate (98.0%, Alfa Aesar) x mmol (x = 1.5, 2, 3) and cobalt acetate tetrahydrate (98%, Daejung) 1 mmol, and the mixture was completely dissolved under magnetic stirring. Subsequently, a reflux condenser was attached to the round-bottom flask, and the solution was heated at 170 °C for 2 h. The resulting ZnCo glycolate was washed with acetone and ethanol and then dried at 40 °C for 24 h. Finally, ZnCo glycolate was calcined in air at 350 °C for 5 h with a heating rate of 4 °C/min to obtain ZnO/ZnCo2O4. The sample synthesized using only the Co precursor was denoted as ZC1, while samples synthesized with Zn precursor amounts of 1.5, 2, and 3 mmol were denoted as ZC2, ZC3, and ZC4, respectively. The sample synthesized using only the Zn precursor was denoted as ZC5.
- 2-2. Characterization
- The morphology and structural characteristics of the samples were analyzed using field-emission scanning electron microscopy (FE-SEM, Hitachi SU5000), X-ray diffraction (XRD, Rigaku MiniFlex), and transmission electron microscopy (TEM, JEOL JEM-F200). Phase identification was performed using standard diffraction data from the ICDD database (PDF-2). The surface chemical states of the samples were investigated using X-ray photoelectron spectroscopy (XPS, Thermo Fisher Scientific Sigma Probe), and Raman spectra were measured using a raman spectrometer (Renishaw inViaTM) with a 633 nm laser.
2. Experimental Section
- Fig. 1 schematically illustrates the formation process of Co–Zn–O oxides from mixed Co and Zn precursors. In solution, Zn–Co composite precursors are first formed through coordination interactions. Under reflux conditions, ZnCo glycolate is synthesized, in which ethylene glycol acts not only as a solvent but also as a coordinating ligand, forming complexes with Zn and Co ions. The nanostructured morphology of the final oxide products was subsequently observed by SEM.
- The sample synthesized using only the Co precursor, ZC1, exhibits a nanoflower morphology (Fig. 2a), whereas the sample synthesized using only the Zn precursor, ZC5, forms nanoparticles (Fig. 2c). These morphological features are preserved even after thermal treatment (Fig. 2b and 2d), indicating that the structures are stable during calcination.
- When Zn and Co are co-introduced, distinct morphological characteristics are observed depending on the molar ratio of the metal ions. Ethylene glycol controls particle growth by forming complexes with metal ions and suppressing aggregation. The Zn-only sample (ZC5) undergoes isotropic growth, resulting in spherical particles, whereas the Co-only sample (ZC1) forms layered Co(OH)2 structures, which induce anisotropic growth into nanosheets that subsequently self-assemble into nanoflower structures [18-20]. The sample with the lowest Co content, ZC4, exhibits aggregated nanoparticles with irregular morphology (Fig. 3g and 3h). The ZC3 sample shows a dominant nanorod structure (Fig. 3d and 3e), whereas ZC2 forms hexagonal nanodisks with a thickness of approximately 100 nm (Fig. 3a and 3b). All samples retain their initial morphology after thermal treatment, indicating that the structures are maintained without collapse during calcination. These morphological variations can be attributed to the role of Co ions during crystal growth. During nucleation, Co ions preferentially adsorb onto specific crystal facets of ZnO and act as bridging species between nanoparticles, promoting aggregation [21, 22]. As the Co concentration increases, facet-selective adsorption modifies the surface energies and growth rates of different crystallographic planes, thereby inducing anisotropic growth. As a result, the morphology evolves from isotropic nanoparticles to anisotropic nanorods and nanodisks [23].
- Fig. 4 presents the EDX spectra of the synthesized samples. Zn and Co are simultaneously detected in ZC2, ZC3, and ZC4. The atomic percentages of Zn and Co in ZC2 are 25.9 % and 12.42 %, respectively. In ZC3, Zn and Co are 34.16 % and 13.16 %, while in ZC4, Zn and Co are 42.64 % and 12.46%, respectively. As summarized in Table 1, the Zn/Co atomic ratio increases with increasing Zn precursor concentration, showing values of 2.09 for ZC2, 2.60 for ZC3, and 3.42 for ZC4. This indicates that compositional control during synthesis directly influences the elemental composition of the final products.
- Fig. 5 shows the XRD patterns of ZC5 and ZC1. ZC5 matches well with the wurtzite ZnO structure (ICDD PDF #79-0205), confirming the formation of pure ZnO. ZC1 corresponds to Co3O4 (ICDD PDF #80-1545), indicating the successful formation of spinel Co3O4.
- Fig. 6a presents the XRD patterns of samples with different Zn/Co ratios. ZC4 exhibits a single ZnO phase without impurity peaks, indicating that Co does not induce phase transformation under this condition. As the Zn content decreases, the ZnO crystal structure is maintained, but the full width at half maximum (FWHM) of the diffraction peaks gradually increases. The magnified XRD pattern (Fig. 6b) shows that the FWHM of the ZnO (101) peak increases and splitting of the ZnCo2O4 (311) peak is observed, indicating the coexistence of ZnO and ZnCo2O4 phases in ZC2 and ZC3. These observations indicate that excessive Co incorporation leads to phase transformation rather than simple substitutional doping. Cobalt promotes cation redistribution within the lattice, leading to the formation of thermodynamically stable spinel ZnCo2O4. In this structure, Zn2+ occupies tetrahedral sites and Co3+ occupies octahedral sites. Fig. 6c shows a TEM image of the ZnO/ZnCo2O4(ZC2). Fig. 6d and 6e present magnified TEM images, where lattice spacings of approximately 0.28 nm and 0.24 nm are observed, corresponding to the (100) plane of ZnO and (311) planes of ZnCo2O4, respectively.
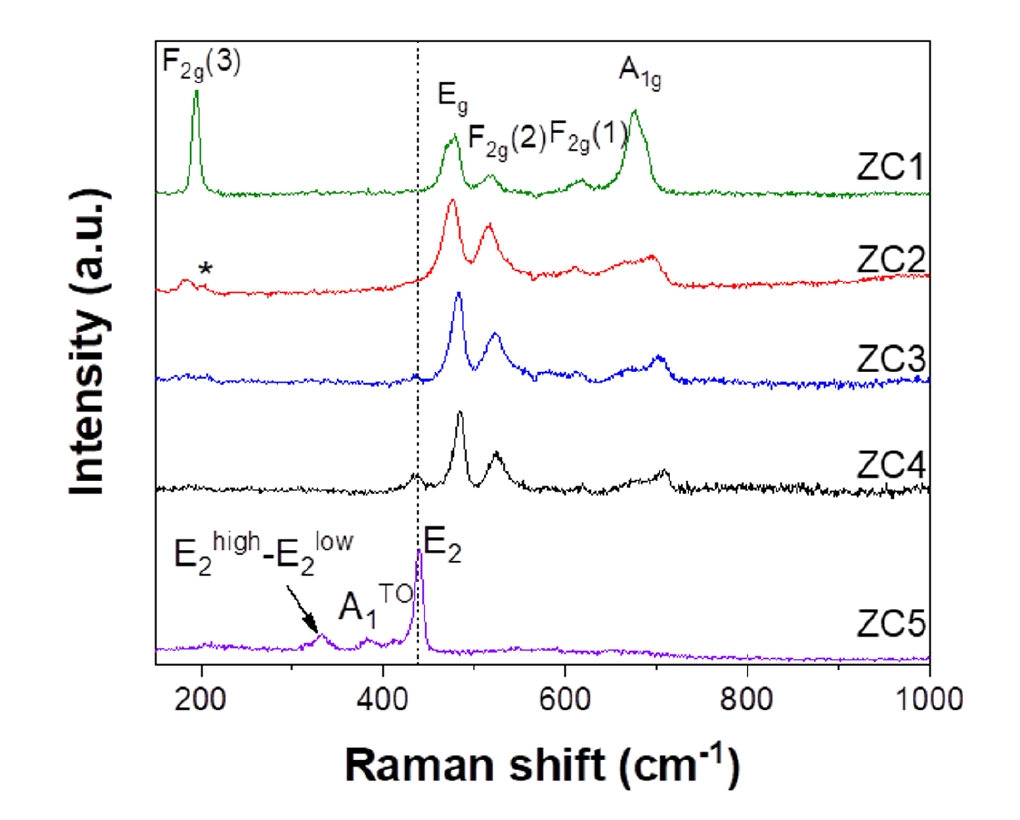
- Fig. 7 shows the Raman spectra of the samples. The pure ZnO sample (ZC5) exhibits a multiphonon vibration at 332 cm-1 corresponding to the E2high-E2low mode and a peak at 381 cm-1 corresponding to the A1TO mode. The peak at 430 cm-1 observed in ZC5, ZC4, and ZC3 corresponds to the E₂ mode of wurtzite ZnO, which is associated with oxygen vibrations, and its intensity decreases with decreasing Zn composition [24, 25]. In ZC3 and ZC2, characteristic Raman modes of ZnCo2O4 are observed. The F2g(3) mode at approximately 180 cm-1 corresponds to Zn2+-O stretching in tetrahedral sites, while the A1g mode at approximately 615 cm-1 corresponds to Co3+-O symmetric stretching in octahedral sites. Additional modes at 480, 518, and 603 cm-1 correspond to Eg and F2g vibrations associated with Zn-O and Co-O bonds [26, 27]. The splitting of the F₂g(3) mode into peaks at approximately 193 cm-1 and 200 cm-1 (*) is attributed to cation disorder caused by partial substitution of Zn2+ by Co2+ in tetrahedral sites [28]. This cation redistribution leads to local symmetry breaking and lattice distortion. The Raman results are consistent with XRD analysis, where ZC3 and ZC2 exhibit coexistence of ZnO and ZnCo2O4 phases, while ZC2 shows dominant ZnCo2O4 features. Overall, increasing cobalt concentration shifts the phase equilibrium toward ZnCo2O4 formation due to enhanced cation diffusion and redistribution.
- The surface chemical states and elemental compositions of the samples were examined using X-ray photoelectron spectroscopy (XPS). Fig. 8a–c present the survey spectrum together with the fine scanned Zn 2p and Co 2p spectra, enabling detailed analysis of the chemical bonding states of each element. In the survey spectra of ZC2, ZC3, and ZC4, both Zn and Co signals are clearly observed, and the corresponding XPS-derived compositions are summarized in Table 1. As the Zn precursor concentration increases during synthesis, the atomic percentages of Zn and Co vary accordingly. In ZC2, the atomic fractions of Zn and Co are 27.04 % and 13.51 %, respectively, whereas ZC3 exhibits 38.87 % Zn and 6.86 % Co, and ZC4 shows 39.46 % Zn and 6.30 % Co. The Zn/Co atomic ratio increases progressively from ZC2 (2.00) to ZC3 (5.67) and ZC4 (6.26) with increasing Zn precursor concentration, indicating that the compositional variation introduced during synthesis is directly reflected in the final elemental composition, consistent with the trend obtained from EDX analysis. In the fine scanned Zn 2p spectra regions, the Zn 2p3/2 and Zn 2p1/2 peaks remain at similar binding energies after cobalt incorporation, with a gradual broadening of the peak width. This broadening reflects increased local structural heterogeneity and lattice distortion associated with the incorporation of Co into the ZnO lattice. In the Co 2p fine spectra regions, the Co 2p3/2 and Co 2p1/2 peaks become progressively narrower as the cobalt content increases, indicating that the chemical environment of cobalt becomes more uniform and that the oxidation state is stabilized. At lower cobalt content, Co ions are more likely to be distributed inhomogeneously within the ZnO lattice, leading to lattice distortion and the formation of Co–O-related defects, which contribute to the broader Co 2p peaks [29, 30]. With increasing cobalt concentration, the Co 2p peaks shift slightly toward higher binding energy, which is associated with strengthened Co-O interactions and charge redistribution accompanying the formation of the ZnCo2O4 phase, together with improved crystallinity of the system [31].
- The structural evolution observed in these samples is closely correlated with cobalt concentration. SEM–EDX analysis shows that the Zn content increases with increasing Zn precursor concentration, which is consistent with the compositional trend obtained from XPS analysis. The combined results from XRD, Raman spectroscopy, and XPS indicate that increasing cobalt content leads to the incorporation of Co ions into the ZnO lattice, while at Zn:Co ratios above 2:1, interaction between Zn and Co species results in the formation of a spinel ZnCo2O4 phase.
3. Results and Discussion
- This study demonstrates that cobalt incorporation plays a decisive role in governing phase evolution and morphological transformation in Co–Zn–O oxides. Rather than acting as a simple dopant, cobalt induces cation redistribution within the lattice, leading to a phase transition from wurtzite ZnO to spinel ZnCo2O4. Simultaneously, cobalt modifies crystal growth kinetics through facet-selective adsorption, resulting in a morphology transition from isotropic nanoparticles to anisotropic nanostructures. These findings reveal that cobalt concentration serves as a key parameter that simultaneously controls phase stability, cation distribution, and growth behavior. This work provides fundamental insight into cation-driven structural evolution in ZnO-based systems and suggests a rational strategy for tailoring oxide materials without external structure-directing agents.
4. Conclusion
-
Funding
This work was supported by the National Research Foundation of Korea (NRF) and the Commercialization Promotion Agency for R&D. Outcomes (COMPA) grant funded by the Korea government (Ministry of Science and ICT) (RS-2024-00432910).
-
Conflict of Interest
The authors have no conflicts of interest to declare.
-
Data Availability Statement
The data that support the findings of this study are available from the corresponding author upon reasonable request.
-
Author Information and Contribution
Deukhyeon Nam: PhD Candidate; Investigation (synthesis), Data curation, Writing – original draft.
Sungdo Yun: PhD Candidate; XRD analysis and Interpretation.
Bo Eun Choi: PhD Candidate; XPS analysis and Interpretation.
Chan Woong Na: PhD; Raman spectroscopy analysis and Writing – review & editing.
Yoon Myung: PhD; Supervision, Funding acquisition, and Project administration.
-
Acknowledgments
None.
Article information


- 1. S. R. Kelly, X. Shi, S. Back, L. Vallez, S. Y. Park, S. Siahrostami, X. Zheng and J. K. Nørskov: ACS Catal., 9 (2019) 4593.Article
- 2. K. G. Krishna, G. Umadevi, S. Parne and N. Pothukanuri: J. Mater. Chem. C, 11 (2023) 3906.Article
- 3. L. Wang, G. Zhang, Q. Liu and H. Duan: Mater. Chem. Front., 2 (2018) 1414.Article
- 4. B. D. Boruah: Nanoscale Adv., 1 (2019) 2059.Article
- 5. L. F. D. Pereira, W. L. Ferreira, B. S. Correa, M. S. Costa, C. S. Costa, A. A. M. Filho, T. S. N. Sales, B. Bosch-Santos, J. Schell, A. Burimova, R. N. Saxena, G. A. Cabrera-Pasca and A. W. Carbonari: Crystals, 14 (2024) 51.Article
- 6. L. Xu, Y. L. Hu, C. Pelligra, C. H. Chen, L. Jin, H. Huang, S. Sithambaram, M. Aindow, R. Joesten and S. L. Suib: Chem. Mater., 21 (2009) 2875.Article
- 7. S. Das, K. Dutta and A. Pramanik: CrystEngComm, 15 (2013) 6349.Article
- 8. S. Akir, A. Hamdi, A. Addad, Y. Coffinier, R. Boukherroub and A. D. Omrani: Appl. Surf. Sci., 400 (2017) 461.Article
- 9. S. Akir, A. Barras, Y. Coffinier, M. Bououdina, R. Boukherroub and A. D. Omrani: Ceram. Int., 42 (2016) 10259.Article
- 10. R. Elilarassi and G. Chandrasekaran: Optoelectron. Lett., 6 (2010) 6.ArticlePDF
- 11. K. Kumar, M. Chitkara, I. S. Sandhu, D. Mehta and S. Kumar: J. Alloy. Compd., 588 (2014) 681.Article
- 12. M. I. Din, R. Khalid, Z. Hussain, S. Gul and A. Mujahid: Desalin. Water Treat., 314 (2024) 100002.Article
- 13. R. D. Shannon: Acta Cryst., 32 (1976) 751.Article
- 14. J. M. Gonçalves, M. I. da Silva, M. N. T. Silva, P. R. Martins, E. Nossol, H. E. Toma and L. Angnes: Energy Adv., 1 (2022) 793.Article
- 15. D. Maity, K. Karmakar, D. Pal, S. Saha, G. G. Khan and K. Mandal: ACS Appl. Energy Mater., 4 (2021) 11599.Article
- 16. T. Xu, J. Zhao, F. Zhao, W. Cong and G. Wang: Sens. Actuators B Chem., 394 (2023) 134338.Article
- 17. K. Goswami, R. Ananthakrishnan and S. Mandal: Mater. Chem. Phys., 206 (2018) 174.Article
- 18. B. W. Chieng and Y. Y. Loo: Mater. Lett., 73 (2012) 78.Article
- 19. L. X. Yang, Y. J. Zhu, L. Li, L. Zhang, H. Tong, W. W. Wang, G. F. Cheng and J. F. Zhu: Eur. J. Inorg. Chem., 2006 (2006) 4787.ArticlePDF
- 20. C. Li, X. Zhang, P. Yu, H. Zhang, X. Sun and Y. Ma: CrystEngComm, 16 (2014) 7478.Article
- 21. K. Hamidian, M. Sarani, A. Najafidoust, J. kadkhodaei and A. Sardashti-Birjandi: Results Chem., 5 (2023) 100734.Article
- 22. L. K. Gaur, P. Gairola, S. P. Gairola, M. C. Mathpal, P. Kumar, S. Kumar, D. Kushavah, V. Agrahari, F. F. H. Aragon, M. A. G. Soler and H. C. Swart: J. Alloys Compd., 868 (2021) 159189.Article
- 23. X. Han, S. Wahl, P.A. Russo and N. Pinna: Nanomaterials, 8 (2018) 249.Article
- 24. A. Chanda, S. Gupta, M. Vasundhara, S. R. Joshi, G. R. Mutta and J. Singh: RSC Adv., 7 (2017) 50527.Article
- 25. S. Dev G, V. Sharma, A. Singh, V. S. Baghel, M. Yanagida, A. Nagataki and N. Tripathi: RSC Adv., 9 (2019) 26956.Article
- 26. V. Venkatachalam, A. Alsalme, A. Alswieleh and R. Jayavel: Chem. Eng. J., 321 (2017) 474.Article
- 27. S. B. Kokane, S. R. Suryawanshi, R. Sasikala, M. A. More and S. D. Sartale: Mater. Chem., Phys., 194 (2017) 55.Article
- 28. J. P. Morán-Lázaro, F. López-Urías, E. Muñoz-Sandoval, O. Blanco-Alonso, M. Sanchez-Tizapa, A. Carreon-Alvarez, H. Guillén-Bonilla, M. D. Olvera-Amador, A. Guillén-Bonilla and V.M. Rodríguez-Betancourtt: Sensors, 16 (2016) 2162.Article
- 29. M. C. Biesinger, B. P. Payne, A. P. Grosvenor, L. W. M. Lau, A. R. Gerson and R. S. C. Smart: Appl. Surf. Sci., 257 (2011) 2717.Article
- 30. H. Hao, M. Qin and P. Li: J. Alloys Compd., 515 (2012) 143.Article
- 31. Y. Long, X. Zhu, C. Gao, W. Si, J. Li and Y. Peng: Nat. Commun., 16 (2025) 1048.Article
References
Figure & Data
References
Citations
 ePub Link
 Cite this Article


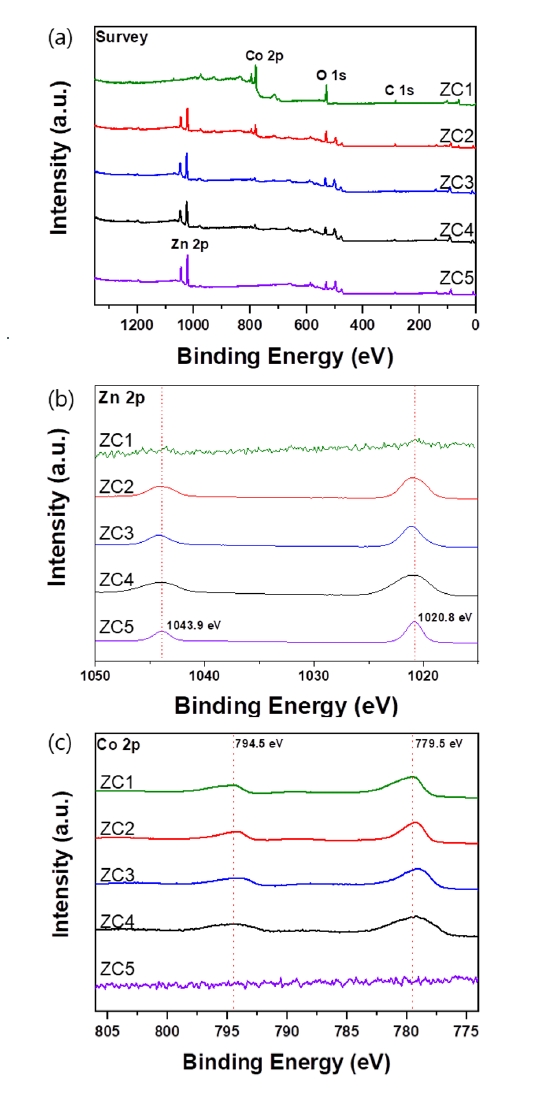
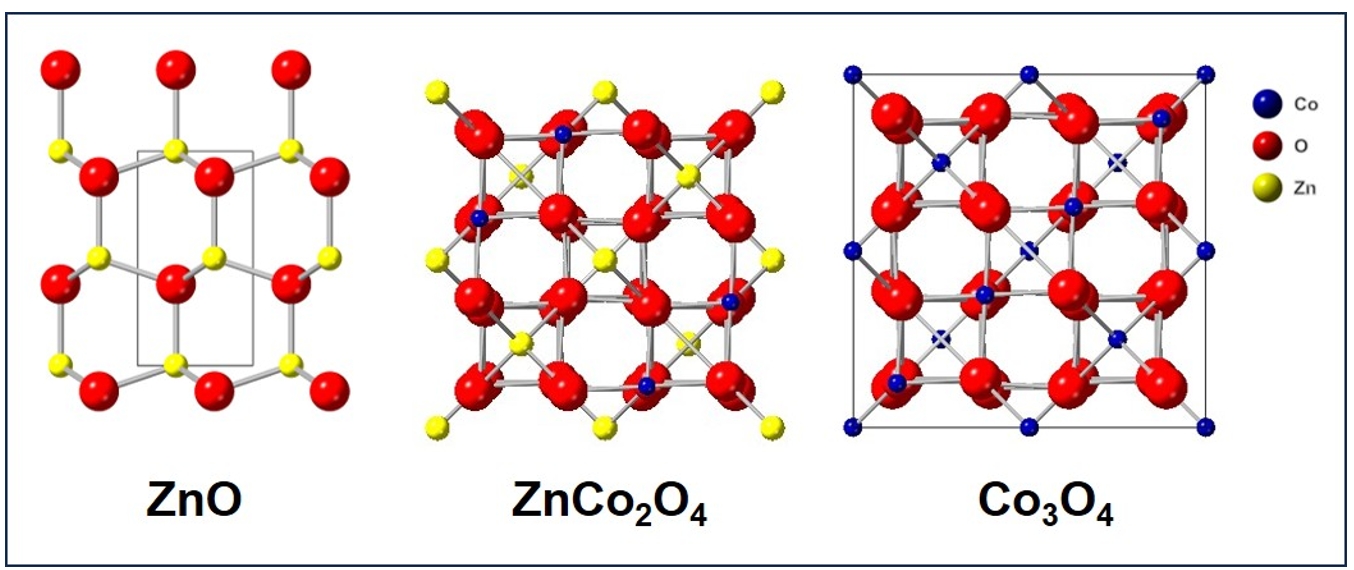


Fig. 1.
Fig. 2.
Fig. 3.
Fig. 4.
Fig. 5.
Fig. 6.
Fig. 7.
Fig. 8.
Graphical abstract
| Sample | EDX | XPS | ||||||
|---|---|---|---|---|---|---|---|---|
| Element At (%) | Element At (%) | |||||||
| Zn | Co | O | Zn/Co | Zn | Co | O | Zn/Co | |
| ZC1 | - | 39.5 | 60.5 | - | 31.14 | 68.86 | ||
| ZC2 | 25.9 | 12.42 | 61.68 | 2.09 | 27.04 | 13.51 | 59.45 | 2.00 |
| ZC3 | 34.16 | 13.16 | 52.68 | 2.60 | 38.87 | 6.86 | 54.27 | 5.67 |
| ZC4 | 42.64 | 12.46 | 44.9 | 3.42 | 39.46 | 6.30 | 54.24 | 6.26 |
| ZC5 | 45.85 | - | 54.15 | - | 51.77 | 48.23 | ||
EDX, energy-dispersive X-ray spectroscopy; XPS, X-ray photoelectron spectroscopy
Table 1.
TOP
