
Articles
- Page Path
- HOME > J Powder Mater > Volume 33(2); 2026 > Article
-
Research Article
- Effect of Compositional Trade-off Between Cr and Mo on the Corrosion Resistance of Additively Manufactured Co-Cr-Fe-Ni-Mo High-Entropy Alloys
- Jeongmin Lee1,†, Yeonghwan Song1,†, Jae Hyuk Lee2, Sung-Jae Jo1, Minho Shin1, Hyunbin Lim2, Soon-Jik Hong1,3, Soo-Hyun Joo2,*
-
Journal of Powder Materials 2026;33(2):137-144.
DOI: https://doi.org/10.4150/jpm.2026.00087
Published online: April 30, 2026
1Division of Advanced Materials Engineering, Kongju National University, Cheonan 31080, Republic of Korea
2Department of Materials Science and Engineering, Dankook University, Cheonan 31116, Republic of Korea
3Center for Advanced Powder Materials and Parts of Powder (CAMP2), Kongju National University, Cheonan 31080, Republic of Korea
- *Corresponding author: Soo-Hyun Joo E-mail: jjsh83@dankook.ac.kr
- †These authors contributed equally to this work
© The Korean Powder Metallurgy & Materials Institute
This is an Open Access article distributed under the terms of the Creative Commons Attribution Non-Commercial License (http://creativecommons.org/licenses/by-nc/4.0/) which permits unrestricted non-commercial use, distribution, and reproduction in any medium, provided the original work is properly cited.
- 884 Views
- 21 Download
Abstract
- In this study, the corrosion behavior of Co-Cr-Fe-Ni-Mo high-entropy alloys additively manufactured via direct energy deposition was investigated according to the compositional trade-off between Cr and Mo elements. Two distinct alloy compositions were fabricated by adjusting the feeding rate of two powders with different chemical compositions through a dual nozzle. Electrochemical testing in a 3.5 wt% NaCl solution revealed that the Cr-rich and Mo-lean alloy exhibited inferior corrosion resistance compared to the Cr-lean and Mo-rich alloy. Specifically, the corrosion potential of the Cr-rich and Mo-lean alloy shifted negatively by approximately 200 mV compared to the Cr-lean and Mo-rich alloy, accompanied by an increase in corrosion current density and the pronounced initiation of localized pitting. This deterioration is attributed to a lack of passivation caused by the small amount of Mo in the Cr-rich and Mo-lean alloy. The passive film of the Cr-lean and Mo-rich alloy was more robust, characterized by a higher concentration of Mo, which effectively inhibited pit propagation through repassivation. These findings demonstrate that maintaining a critical Cr-Mo balance is more vital for the electrochemical stability of additively manufactured high-entropy alloys than unilateral Cr enrichment.
- Recently, the paradigm of alloy design has shifted significantly with the emergence of high-entropy alloys (HEAs), which utilize multi-component alloy system to achieve properties that cannot achieved by conventional dilute alloys [1-3]. Among the various HEA systems, the Co-Cr-Fe-Ni-Mo alloy system has garnered intense interest due to its exceptional combination of mechanical strength and corrosion resistance [3-7]. In particular, several studies have been reported that the Co-Cr-Fe-Ni-Mo system exhibits excellent passivity due to their high Cr and Mo contents [5, 6]. While Cr is an essential element in the formation of the Cr-rich passive film, Mo plays a decisive role in enhancing pitting resistance [8]. The Mo element is well-established to form a Mo-rich protective layer, stabilizing the passive film and promoting the rapid repassivation of metastable pits [9], Thus, in surface engineering applications, it is often desirable to enrich specific elements like Cr and Mo to maximize passivity [10].
- Since corrosion is inherently a surface-initiated phenomenon, the development of HEA-based coatings has become an important area of interest [11-13]. In this context, direct energy deposition (DED), a laser-based additive manufacturing process, has demonstrated a potential as a high-performance cladding and coating technology [14, 15]. Unlike conventional thermal spraying or physical vapor deposition, DED offers several distinct advantages for the fabrication of corrosion-resistant coatings, including high metallurgical bonding strength with the substrate and the ability to build complex geometries or repair localized surface damage [16-18]. Despite these advantages, the electrochemical performance of DED-processed HEAs is highly sensitive to the precise chemical balance of the deposited layer. Furthermore, the rapid solidification during DED process induces the formation of non-equilibrium microstructures such as cellular structures and localized solute segregation [19]. These microstructural features significantly differ from those found in cast or wrought counterparts, influencing the corrosion behavior of DED-processed HEAs. While previous studies have focused on the individual effects of increasing either Cr or Mo concentration on passivity [6, 20], there is a limited understanding of the compositional trade-off effect between these two elements.
- In this study, the impact of compositional trade-off between Cr and Mo on the corrosion resistance of Co-Cr-Fe-Ni-Mo HEA system was investigated. Employing a dual-nozzle DED process, it was confirmed that increasing the Cr content while decreasing the Mo content leads to a catastrophic failure of pitting resistance due to the scarcity of Mo. Through electrochemical analysis accompanied by microstructural characterization, we elucidated the transition mechanism from a stable passivation in the Mo-enriched alloy to localized breakdown in the Cr-enriched alloy. This work provides a new critical design criterion for maintaining the chemical balance of multi-component alloys fabricated by additive manufacturing.
1. Introduction
- 2.1 Sample preparation
- To achieve systematic modulation of the Cr and Mo contents, an in-situ alloying strategy [21] was implemented using a laser-based DED machine equipped with a dual-nozzle powder feeding system (MX-Lab, InssTek, Republic of Korea). For in-situ alloying, spherical powders with two different compositions, Co21Cr7Fe50Ni12Mo10 and Fe63Cr37 (at%), and a particle size in the range of 45 to150 μm were prepared using gas atomization. Figs. 1(a, b) show the morphology and particle size distribution of powders analyzed using scanning electron microscopy (SEM), and the chemical composition of the initial powders measured by energy dispersive spectroscopy (EDS) were given in Table 1.
- By independently controlling the feeding rates of the two powders injected into a single molten pool, two different alloy variants were produced to investigate the compositional trade-off effect between Cr and Mo (Fig. 1(c)). The feeding rates of powders are presented in Table 2. Hereinafter, the fabricated alloys are referred to as FeCr0.3 and FeCr0.5 according to the feeding rate of Fe-Cr powder. Disk-shaped specimens with a diameter of 15 mm and a thickness of 3 mm for electrochemical corrosion testing were built on a 316L stainless steel substrate (Fig. 1(d)). Other process parameters, including laser powder of 250 W, scanning speed of 850 mm/min, hatch spacing of 0.3 mm, and bidirectional rotation of 90° during deposition, were used identically for both alloys.
- 2.2 Electrochemical corrosion testing
- Potentiodynamic polarization tests were conducted in a 3.5 wt% NaCl solution under an argon atmosphere at a potential scan rate of 1 mV/s, using a VSP potentiostat (Biologic, France). For potentiodynamic polarization testing, a three-electrode cell configuration was employed with an Ag/AgCl electrode in a saturated KCl solution as the reference electrode, a graphite electrode as the counter electrode, and the DED-processed HEA specimens as the working electrode with an exposed area of 1 cm2. Prior to electrochemical measurements, the surface of the disk-shaped specimens was polished with SiC paper up to 1200-grit, and then immersed in the NaCl solution for 30 minutes to achieve a stable open circuit potential.
- 2.3 Microstructural characterization and surface analysis
- Microstructural characterization was performed using a SEM (MIRA GMS, TESCAN, Czech Republic) equipped with EDS and backscattered electron (BSE) detectors. The specimens for microstructural observation were polished up to 1200-grit SiC paper, followed by polishing with 3 and 1 μm diamond suspensions. Pit depths were estimated using cross-sectional SEM imaging by measuring the maximum vertical distance from the original surface to the pit floor. The surface of the specimens after corrosion testing was analyzed using an X-ray photoelectron spectroscopy (XPS) equipment (K-Alpha, Thermo Fisher Scientific, USA).
2. Experimental
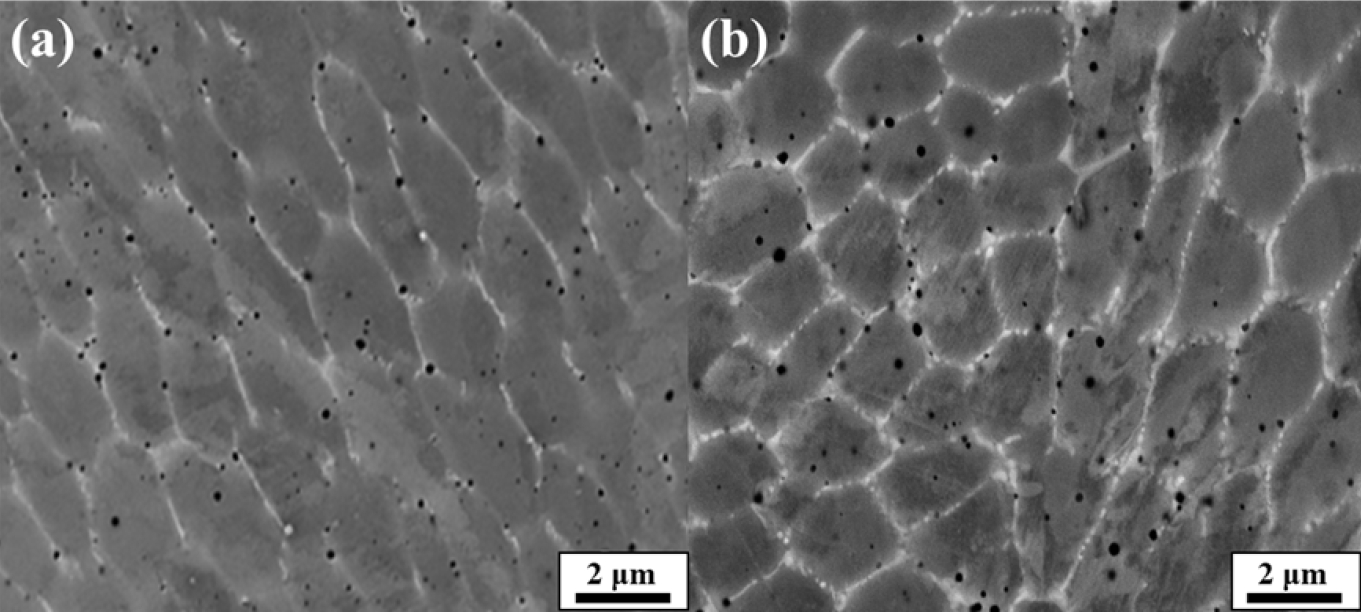
- 3.1 Initial microstructure
- Fig. 2 revealed the as-built microstructure of the FeCr0.3 and FeCr0.5. The rapid solidification of the laser-based DED process resulted in fine cellular structure in both alloys. The chemical composition of the alloys measured by EDS confirms that noticeable micro-segregation across the cell structure, as summarized in Table 3. In both alloys, Mo and Cr are partitioned into the cell boundaries, while Co, Ni, and Fe are slightly enriched in the cell interiors. The development of compositional partitioning between the cell interior and boundary is attributed to the solute redistribution during rapid solidification of laser-based DED process. Under these non-equilibrium solidification conditions, the local solidification front moves too quickly for long-range diffusion to homogenize the liquid composition. In the current alloy system, elements such as Mo and Cr, which typically have equilibrium partition coefficients less than 1 [22, 23], are rejected into the liquid phase during the rapid growth of the solid cells. As a result, Mo and Cr are concentrated at the cell boundaries, which is the final solidification front. As the feeding rate of Fe-Cr powder increased, the Fe and Cr contents of the alloy increased, while the content of other elements decreased accordingly. Thus, the FeCr0.5 alloy becomes Cr-rich and Mo-lean compared to the Cr-lean and Mo-rich FeCr0.3 alloy.
- 3.2 Electrochemical testing
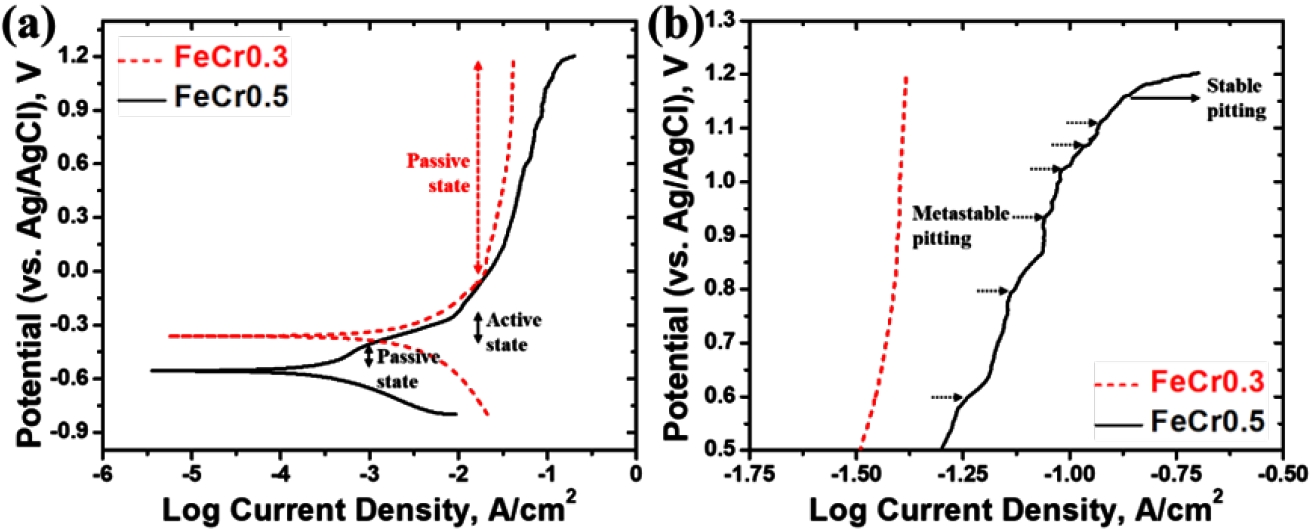
- The potentiodynamic polarization curves of the alloys are shown in Fig. 3(a). The corrosion potential (Ecorr) and corrosion current density (Icorr) of the FeCr0.3 alloy are -362 mV and 199 μA/cm2, respectively, while those of the FeCr0.5 alloy are -557 mV and 501 μA/cm2, respectively. The electrochemical results clearly indicate that the FeCr0.5 alloy exhibits inferior corrosion resistance compared to the FeCr0.3 alloy. Despite its higher Cr content, the FeCr0.5 alloy showed a more negative Ecorr and a significantly higher Icorr compared to the FeCr0.3 alloy, demonstrating that the FeCr0.5 alloy possesses higher corrosion susceptibility in chloride environments. The lower Ecorr of the FeCr0.5 alloy is associated with the enhanced anodic dissolution tendency compared to FeCr0.3 alloy. According to the previous work [24], the sparsity of Mo in the FeCr0.5 alloy may reduce the energy barrier for initial metallic ionization at the surface. Specifically, the Mo-depleted cell interior in the FeCr0.5 alloy containing 1.38 wt% lower Mo content compared to the cell interior of the FeCr0.3 alloy (Table 3) act as predominant active sites that accelerate the anodic reaction at lower potential.
- In the beginning of the anodic reaction, the FeCr0.5 alloy rapidly becomes a passive state and immediately transforms to an active state (Fig. 3(a)). It should be noted that the Icorr of the FeCr0.5 alloy is higher compared to that of the FeCr0.3 alloy, which indicates the initial rate of anodic reaction is accelerated in the FeCr0.5 alloy. Although Cr is the primary element responsible for the initial formation of the Cr-rich passive film, the thermodynamic stability of the passive film is more heavily influenced by the presence of Mo [25]. In the FeCr0.5 alloy, the lower Mo content at the cell interior compared to the FeCr0.3 alloy leads to the rapid transition into the passive state at the lower potential. This implies that the higher Cr content in the FeCr0.5 alloy might promote a thicker initial passive film, it lacks the self-healing capacity provided by the Mo element. Meanwhile, the FeCr0.3 alloy exhibits the stable passivation without transition to an active state or metastable pitting within the tested potential range, which demonstrates superior pitting resistance compared to the FeCr0.5 alloy. Although the FeCr0.5 alloy also exhibits second passivation within the same potential range (above 0 mV), it appears higher current density and the occurrence of stable pitting at 1166 mV (Epit), while the FeCr0.3 alloy shows no stable pitting in the present test condition. In addition, in the FeCr0.5 alloy, several current transients (brief spikes in current density followed by a return to passive levels) were observed at potentials below the Epit, as shown in Fig. 3(b). These current transients are characteristic of metastable pitting, representing the repeated initiation and repassivation of tiny pits. In contrast, the FeCr0.3 alloy exhibited negligible current fluctuations, indicating a much more stable passive state. The higher Mo content in the FeCr0.3 alloy contributes to the stable passive film and the repassivation, preventing Cl- ions from penetrating passive film.
- 3.3 Corroded surface and cross-sectional analyses
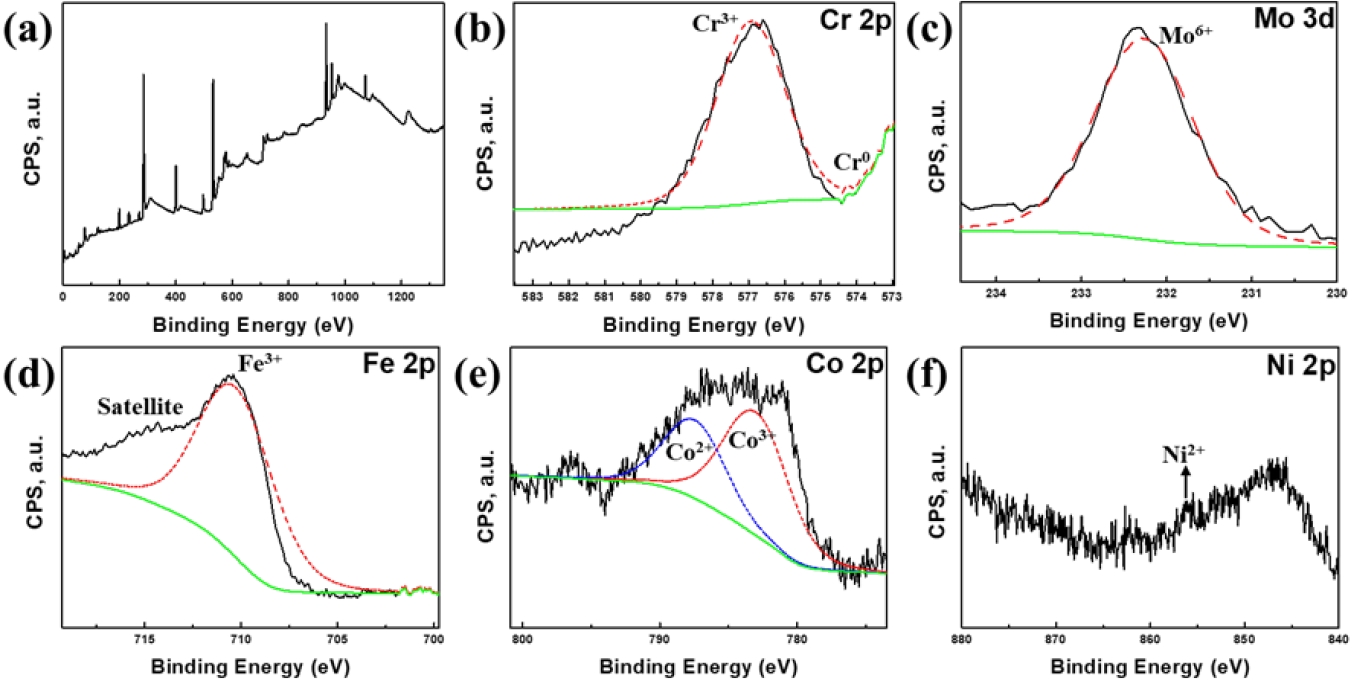
- To elucidate the chemical origin of the superior passivation observed in the FeCr0.3 alloy, XPS analysis was performed on the corroded surface after electrochemical testing (Fig. 4). The Cr 2p spectrum (Fig. 4(b)) clearly demonstrates the predominant peak corresponding to the oxidized Cr3+ species, typically existing as Cr2O3 [7]. The dense Cr2O3 oxide layer in the FeCr0.3 alloy acts as an initial barrier against Cl- ions. The Mo exists mainly in the form of Mo6+ with high-intensity peak, representing MoO3 oxide [26]. This MoO3 oxide layer stabilizes the passive film and promotes repassivation to inhibit pit growth [25], as presented in Fig. 3(b). In other words, Cr is primarily responsible for initial passivation, whereas Mo is essential for repassivation, which stabilizes the film and arrests pit propagation. While Fe and Co also exhibit oxidized states (Fe3+, Co2+, and Co3+) contributing to the film (Figs. 3(c, d)), these elements are generally considered less stable than Cr/Mo oxides in chloride media [27]. Notably, the Ni 2p spectrum (Fig. 3(f)) displays a very low signal-to-noise ratio, with only a small amount of Ni2+ species detected near 855.5 eV. This indicates that Ni preferentially dissolves into the electrolyte during the electrochemical testing, rather than forming a stable passive layer. Consequently, the high density of Mo6+ repassivators within a stable Cr-rich layer rationalizes that the FeCr0.3 alloy maintains stable passivity and effectively prevents localized corrosion attack.
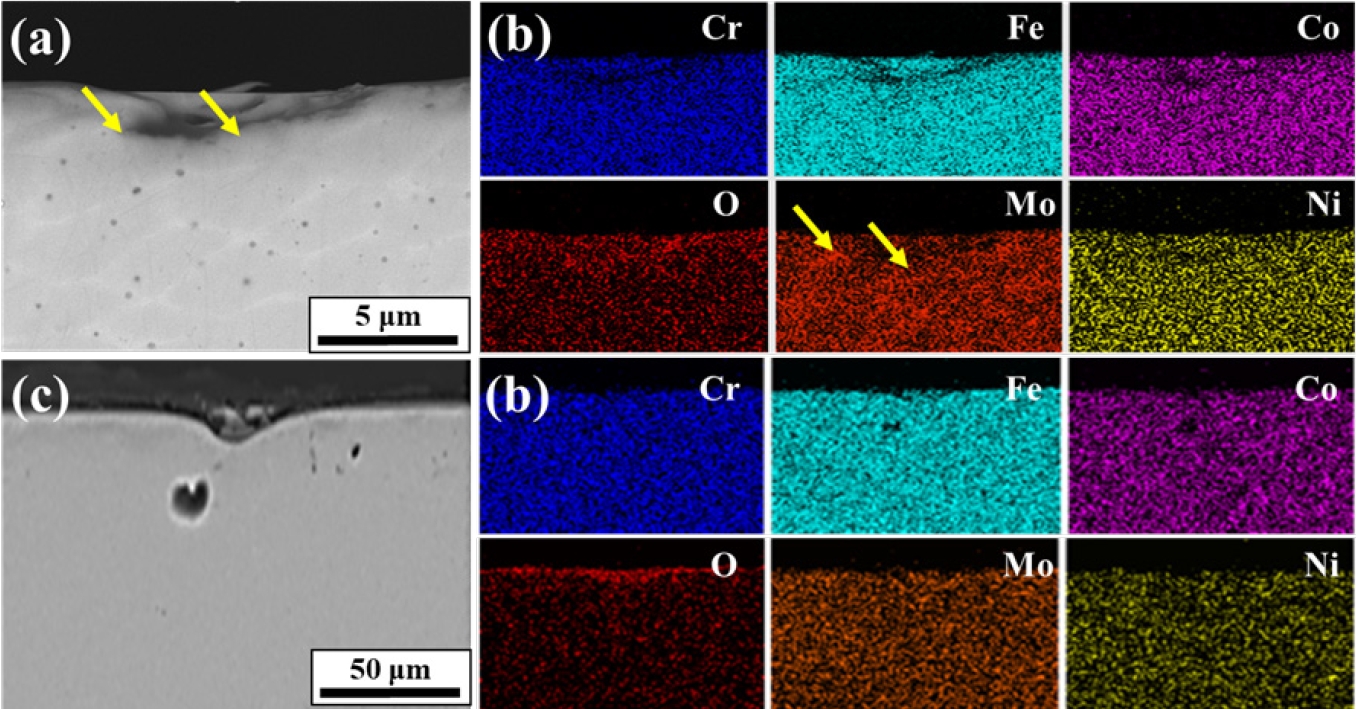
- Figure 5 shows the cross-section of the corroded alloys after electrochemical testing. Cross-sectional images of the corroded FeCr0.3 alloy provide an evidence of the synergistic passivation effect caused by the cellular structure, revealing that the localized repassivation at the Mo-enriched cell boundaries successfully suppress pit growth (Fig. 5(a, b)). At the cell boundaries of the alloys, the high concentration of Mo was observed (Fig. 2 and Table 3). The pit observed in the FeCr0.3 alloy was remarkably shallow with a depth of ~2 μm, indicating an early arrest of pit propagation by Mo-enriched cell boundaries. The cellular network with high Mo concentration provides a continuous path for repassivation, thereby contributing to the excellent pitting resistance of the FeCr0.3 alloy. This phenomenon directly correlates to the exceptionally lower fluctuations of current density observed in the polarization curve of the FeCr0.3 alloy (Fig. 3(b)). In contrast, the corroded FeCr0.5 alloy contains deeper pit with a depth of tens of micrometers compared to the FeCr0.3 alloy (Figs. 5(c, d)), which fails to prevent localized corrosion once it initiated. Although a thin passive film appears to remain visible on the outermost surface of the corroded FeCr0.5 alloy, the observed pit propagated into the interior of the specimen attributed to the absence of sufficient Mo at the cell interiors and boundaries (Table 3).
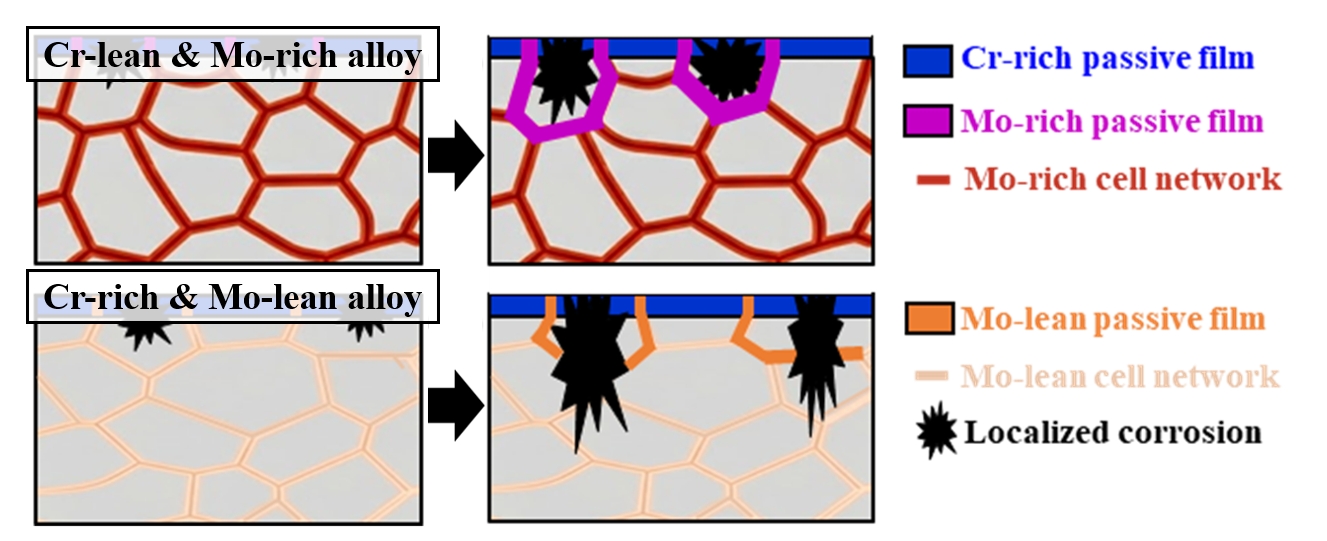
- 3.4 Corrosion mechanisms
- Fig. 6 illustrates the corrosion mechanisms of the present DED-processed alloys during the electrochemical testing. The as-built cellular microstructure shows micro-segregation, with Mo and Cr partitioning to cell boundaries, and the FeCr0.3 alloy contains higher Mo content compared to the FeCr0.5 alloy. At the initial stage of corrosion, a passive film with a relatively Cr-enriched oxide layer on the surface of the cell interior and a relatively Mo-enriched oxide layer on the surface of the cell boundaries (Figs 6(a, c)). In both alloys, pit initiation occurs at the Mo-depleted cell interiors. Once a pit initiation occurs by Cl- attack and the pit encounters the cell boundaries, the high concentration of Mo at the cell boundaries promotes the formation of stable MoO3, which significantly accelerates repassivation kinetics. This rapid repassivation effectively blocks the metastable pits, thereby suppressing their propagation and ensuring the long-term electrochemical durability of the cellular network in the FeCr0.3 alloy (Fig. 6(b)). However, in the FeCr0.5 alloy, the stability of the passive film is much weaker due to the lower Mo content at both cell interiors and boundaries compared to that in the FeCr0.3 alloy. Hence, in the FeCr0.5 alloy, the pits can easily penetrate the weak passive film at the cell boundaries, leading to severe pit propagation into the core of the alloy.
- The bulk composition controlled by the powder feeding rate determines the total availability of passivating elements. However, the local segregation dictates the spatial effectiveness of the passive film. Even if the bulk Cr content is high as in FeCr0.5 alloy, the local depletion of Mo in the cell interiors makes them susceptible to pit initiation, and the insufficient Mo at the cell boundaries fails to arrest pit growth. Thus, the local chemical gradient created by laser-based DED is the dominant factor in determining the pitting resistance. Consequently, the present study highlights that the chemical balance between Cr and Mo is more important than the unilateral Cr enrichment in DED-processed HEAs. It is worth noting that the cellular segregation behavior and its subsequent influence on pitting resistance observed in this study are not limited to the specific DED parameters. While the specific size of the cellular structure may vary with process parameters, the fundamental mechanism in the present work can be a widely applicable concept for designing corrosion-resistant alloys fabricated by laser-based additive manufacturing. Therefore, it is anticipated that the present strategy that utilizes Mo-rich cellular networks contributes to improve the electrochemical durability of various HEAs produced via laser-based additive manufacturing.
3. Results and Discussion
- In this study, the electrochemical corrosion behavior and pitting mechanisms of Co-Cr-Fe-Ni-Mo high-entropy alloys fabricated by DED were investigated. The DED-processed alloys exhibited the Mo-rich cellular network due to the segregation of Mo at the cell boundaries, providing robust repassivation. Compared to the Cr-rich and Mo-lean alloy (FeCr0.5), the Cr-lean and Mo-rich alloy (FeCr0.3) exhibited significantly superior corrosion resistance, which is attributed to the compositional balance between Cr and Mo. Due to the higher Mo content at the cell boundaries in the FeCr0.3 alloy, pitting was successfully suppressed through the formation of Mo-rich oxides and a rapid repassivation. On the other hand, the FeCr0.5 alloy suffered from severe pit propagation caused by the cell boundaries with insufficient Mo content, which is attributed by a lack of repassivation ability. The present work demonstrates that precisely controlling the Cr-Mo balance within the cellular network offered by additive manufacturing serves as an important role for ensuring the electrochemical durability in aggressive chloride environments, significantly expanding their potential for extreme applications.
4. Conclusion
-
Funding
This study was supported in part by the Technology Innovation Program (RS-2025-00431907) funded by the Ministry of Trade, Industry & Energy (MOTIE), Republic of Korea and the Nano & Material Technology Development Program (RS-2023-00281246) through the NRF of Korea funded by MSIT.
-
Conflict of Interest
The authors have no conflicts of interest to declare.
-
Data Availability Statement
Data will be made available on request.
-
Author Information and Contribution
Jeongmin Lee: M.S. candidate, Writing – original draft, Visualization, Investigation, Formal analysis
Yeonghwan Song: Undergraduate student, Visualization, Methodology, Investigation, Formal analysis
Jae Hyuk Lee: Ph.D. candidate, Investigation, Formal analysis
Sung-Jae Jo: Ph.D. candidate, Visualization, Methodology
Minho Shin: M.S. candidate, Visualization, Methodology
Hyunbin Lim: M.S. candidate, Formal analysis
Soon-Jik Hong: Professor, Supervision, Resources
Soo-Hyun Joo: Professor, Writing – review & editing, Supervision, Resources, Funding acquisition, Conceptualization.
-
Acknowledgments
None.
Article information


| Alloys | Powder feeding rate, g/min | |
|---|---|---|
| Co-Cr-Fe-Ni-Mo powder | Fe-Cr powder | |
| FeCr0.3 | 2.2 | 0.3 |
| FeCr0.5 | 2.0 | 0.5 |
- 1. S. H. Joo, H. Kato, M. J. Jang, J. Moon, C. W. Tsai, J. W. Yeh and H. S. Kim: Mater. Sci. Eng. A, 689 (2017) 122–133.Article
- 2. J. Moon, J. M. Park, J. W. Bae, H.-S. Do, B.-J. Lee and H. S. Kim: Acta Mater., 193 (2020) 71.Article
- 3. J. Moon, E. Tabachnikova, S. Shumilin, T. Hryhorova, Y. Estrin, J. Brechtl, P. K. Liaw, W. Wang, K. A. Dahmen, A. Zargaran, J. W. Bae, H.-S. Do, B.-J. Lee and H. S. Kim: Mater. Today, 50 (2021) 55–68.Article
- 4. J. W. Bae, J. M. Park, J. Moon, W. M. Choi, B.-J. Lee and H. S. Kim: J. Alloys Compds., 781 (2019) 75–83.Article
- 5. Q. Wang, Y. Liang, J. Huang, Y. Peng and J. Kong: Intermetallics, 163 (2023) 108082.Article
- 6. O. Samoilova, N. Shaburova, A. O. Moghaddam and E. Trofimov: J. Mater. Eng. Perform., 34 (2025) 25554.ArticlePDF
- 7. J. Moon, Y. Choi, T. Sasaki, M. Joo, H. Shin, J. S. Lee, T. Ohkubo, K. Hono, S. M. Baek and H. S. Kim: Corros. Sci., 193 (2021) 109888.Article
- 8. X. Zhang, J. Zhou, J. J. Noël and D. W. Shoesmith: Surf. Interface Anal., 45 (2013) 1014.Article
- 9. M. P. Ryan, D. E. Williams, R. J. Chater, B. M. Hutton and D. S. McPhail: Nature, 415 (2002) 770.ArticlePDF
- 10. Z. Niu, Y. Wang, C. Geng and J. Xu: J. Alloys Compd., 820 (2020) 153273.Article
- 11. H. Cheng, Z. Pan, Y. Fu, X. Wang, Y. Wei, H. Lou and X. Li: J. Electrochem. Soc., 168 (2021) 111502.ArticlePDF
- 12. C. Lin and Y. Yao: Metals, 13 (2023) 205.Article
- 13. Y. Liu, D. Xiang, K. Wang and T. Yu: Coatings, 12 (2022) 1669.Article
- 14. H. Wu, S. Zhang, Z. Y. Wang, C. H. Zhang, H. T. Chen and J. Chen: Int. J. Refract. Met. Hard Mater., 102 (2022) 105721.Article
- 15. R. E. Kim, J. Moon, E. S. Kim, J. Lee and H. S. Kim: Scr. Mater., 221 (2022) 114989.Article
- 16. F. E. Mariani, G. Y. . Konno, C. B. Cruz, A. N. Lombardi, A. Garcia, N. Cheung, R. T. Coelho and L. C. Casteletti: J. Mater. Eng. Perform., 34 (2025) 19780.ArticlePDF
- 17. A. Aprilia, N. Wu and W. Zhou: Mater. Today Proc., 70 (2022) 206.Article
- 18. A. Sethi, I. Mohanty, S. Misra, R. Chakraborty and P. Saha: Surf. Coat. Technol., 493 (2024) 131268.Article
- 19. J. M. Park, P. Asghari-Rad, A. Zargaran, J. W. Bae, J. Moon, J. Choe, S. Yang, J.-H. Yu and H. S. Kim: Acta Mater., 221 (2021) 117426.Article
- 20. M. Sun, Z. Yang, S. Song, J. Zhang and B. Lu: Mater. Charact., 212 (2024) 113949.Article
- 21. E. Kim, F. Haftlang, S. Y. Ahn, G. H. Gu and H. S. Kim: J. Alloys Compds., 907 (2022) 164415.Article
- 22. C. W. Jung, J. H. Lee, S.-H. Joo, R. E. Kim, H. S. Kim and J. Moon: Mater. Sci. Eng. A, 922 (2025) 147617.Article
- 23. J. H. Lee, J. Lee, H. Kato, S. Yim, D. Lee, G. Song, J. H. Lee, D. J. Lee, Y.-K. Kim, Y.-S. Na, H. S. Kim, J. Moon and S.-H. Joo: Mater. Sci. Eng. A, 960 (2026) 150106.Article
- 24. C. Dai, T. Zhao, C. Du, Z. Liu and D. Zhang: J. Mater. Sci. Technol., 46 (2020) 64.Article
- 25. V. Maurice and P. Marcus: NPJ Mater. Degrad., 8 (2024) 3.Article
- 26. J.-G. Choi and L. T. Thompson: Appl. Surf. Sci., 93 (1996) 143.Article
- 27. C.-O. A. Olsson and D. Landolt: Electrochim. Acta, 48 (2003) 1093.Article
References
Figure & Data
References
Citations
 ePub Link
 Cite this Article
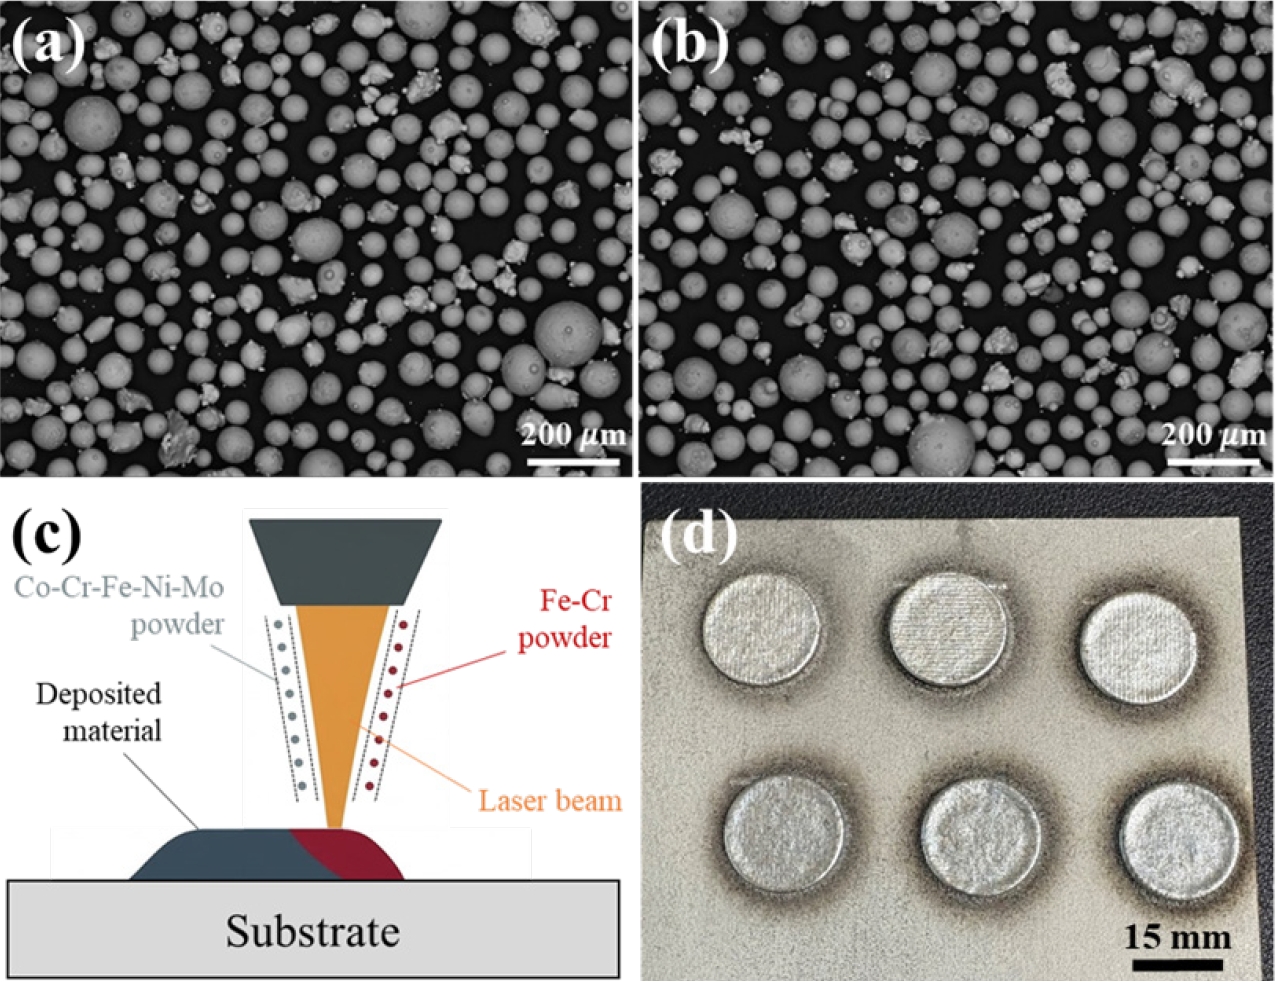


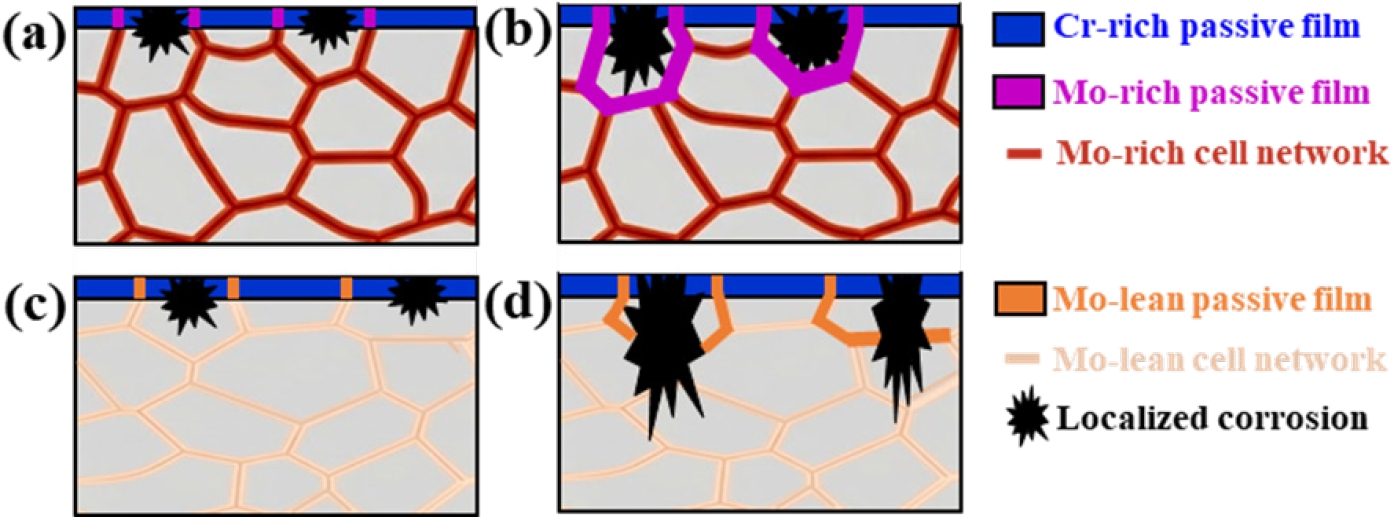


Fig. 1.
Fig. 2.
Fig. 3.
Fig. 4.
Fig. 5.
Fig. 6.
Graphical abstract
| Powder | Chemical composition, at% | ||||||
|---|---|---|---|---|---|---|---|
| Co-Cr-Fe-Ni-Mo powder | Fe-Cr powder | ||||||
| Co | Cr | Fe | Ni | Mo | Fe | Cr | |
| Nominal | 21 | 7 | 50 | 12 | 10 | 63 | 37 |
| EDS | 21.07 ± 2.80 | 6.98 ± 0.76 | 50.10 ± 5.64 | 12.05 ± 1.70 | 9.80 ± 1.79 | 63.02 ± 1.86 | 36.98 ± 1.86 |
| Alloys | Powder feeding rate, g/min | |
|---|---|---|
| Co-Cr-Fe-Ni-Mo powder | Fe-Cr powder | |
| FeCr0.3 | 2.2 | 0.3 |
| FeCr0.5 | 2.0 | 0.5 |
| Location | Chemical composition, at% | |||||
|---|---|---|---|---|---|---|
| Co | Cr | Fe | Ni | Mo | ||
| FeCr0.3 | Cell boundary | 16.89 ± 1.38 | 11.79 ± 1.14 | 51.06 ± 1.12 | 9.25 ± 0.86 | 10.82 ± 0.83 |
| Cell interior | 17.69 ± 0.89 | 10.54 ± 1.11 | 52.07 ± 2.42 | 10.59 ± 0.51 | 8.88 ± 0.83 | |
| FeCr0.5 | Cell boundary | 16.28 ± 1.29 | 13.20 ± 1.29 | 50.91 ± 1.67 | 8.62 ± 0.82 | 9.91 ± 1.31 |
| Cell interior | 17.80 ± 2.03 | 12.84 ± 1.60 | 52.56 ± 1.95 | 9.60 ± 1.27 | 7.50 ± 2.90 | |
Table 1.
Table 2.
Table 3.
TOP
