Articles
- Page Path
- HOME > J Korean Powder Metall Inst > Volume 24(1); 2017 > Article
-
Article
산화·환원법에 의한 폐텅스텐 스크랩의 재활용에 관한 기초연구 - 김상욱, 윤지석, 김태욱, 조봉휘, 김인호, 김상무a, 송창빈a,*
- Basic Study on the Recycling of Waste Tungsten Scraps by the Oxidation and Reduction Process
- Sang-Uk Kim, Ji-seok Yun, Tae-Wook Kim, Bong-Hwi Cho, In-Ho Kim, Sang-Mu Kima, Chang-Bin Songa,*
-
Journal of Korean Powder Metallurgy Institute 2017;24(1):34-40.
DOI: https://doi.org/10.4150/KPMI.2017.24.1.34
Published online: January 31, 2017
엔에이티엠(주) 부설연구소
공주대학교
R&D Center, NATM Co. Ltd., Gyeonggi-do 31056, Republic of Korea
a Department of Advanced Materials Engineering, Kongju National University, Chungnam 31080, Republic of Korea
- * Corresponding Author: Chang-bin Song, TEL: +82-41-521-9374, FAX: +82-41-568-5776, E-mail: cbsong@kongju.ac.kr
© The Korean Powder Metallurgy Institute. All rights reserved.
- 708 Views
- 1 Download
- 1 Crossref
Abstract
- This study is carried out to obtain basic data regarding oxidation and reduction reactions, originated on the recycling of waste tungsten hard scraps by oxidation and reduction processes. First, it is estimated that the theoretical Gibbs free energy for the formation reaction of WO2 and WO3 are calculated as ΔG1,000K= -407.335 kJ/mol and ΔG1,000K = -585.679 kJ/mol, from the thermodynamics data reported by Ihsan Barin. In the experiments, the oxidation of pure tungsten rod by oxygen is carried out over a temperature range of 700-1,000°C for 1 h, and it is possible to conclude that the oxidation reaction can be represented by a relatively linear relationship. Second, the reduction of WO2 and WO3 powder by hydrogen is also calculated from the same thermodynamics data, and it can be found that it was difficult for the reduction reaction to occur at 1,027°C, in the case of WO2, but it can happen for temperatures higher than 1127°C. On the other hand, WO3 reduction reaction occurs at the relatively low temperature of 827oC. Based on these results, the reduction experiments are carried out at a temperature range of 500-1,000°C for 15 min to 4 h, in the case of WO3 powder, and it is possible to conclude that the reduction at 900°C for 2h is needed for a perfect reduction reaction.
- 새로운 21세기에 있어서 자원재활용은 지구의 자원·환 경을 보호하고 고갈위기에 있는 부족한 자원을 효과적·경 제적으로 활용한다는 측면과 함께 중국의 자원 무기화 정 책으로 인한 가격 폭등에 대비하는 측면에서 국내·외적으 로 정책적·기술적인 R&D가 활발하게 진행되고 있다.
- 각종 산업 분야에서 폐기되고 있는 유가금속(valuable metal) 중 부존(賦存) 자원이 적으며 전략물질로 지정되어 있는 텅스텐(W)을 주성분으로 하는 초경합금(cemented carbide)은 오래전부터 재활용(recycling)에 대한 시도가 진 행되어 다양한 연구결과가 보고되어 왔다[1-6]. 그러나 최 근 IT산업, 자동차, 우주항공, 선박, 신재생산업 등 다양한 분야에 걸쳐 폭넓게 사용되어 그 수요가 증가하고 있는 순 텅스텐(W) 제품(도가니, 타겟 등)에 대해서는 재활용에 관한 연구가 거의 없는 실정이다.
- 텅스텐은 모든 원소중 가장 녹는점이 높은 고융점 금속 (3400°C)이기 때문에 일반적으로 순 텅스텐 제품은 분말 야금법(P/M method)으로 제조되고 있으며 사용 후 폐자원 (텅스텐 하드스크랩)을 재활용하기 위해서는 재차 분말화 하는 공정이 중요하다. 현재까지 알려진 방법은 텅스텐 하 드스크랩으로부터 이물질을 분리하고 기계적으로 조분쇄 및 미분쇄 공정을 거친 후, 산소(공기) 분위기에서 고온 가 열(산화)하여 산화물로 제조하고 재차 수소에 의한 환원을 통해 분말로 제조하는 방법, 즉, 산화·환원법(oxidation and reduction process, 이후 O-R process로 약함.)이 있다. 하지만 아직 산화·환원법에 관련된 기초 데이터가 매우 부족한 실정이다.
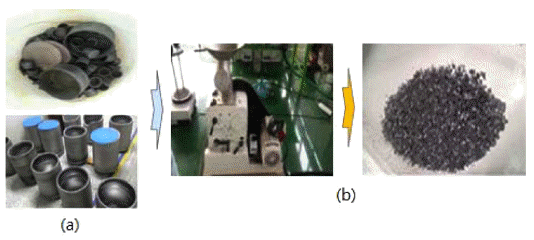
- 따라서 본 연구에서는 순 텅스텐(W) 제품(도가니, 타겟 및 공정 스크랩 등)의 사용 후 폐자원(텅스텐 하드스크랩) 을 재활용하는 데 있어서 산화·환원법의 핵심공정인 산 화·환원 반응(oxidation and reduction reaction) 조건을 조사 하였다. 그림 1은 사용 후 폐기된 각종 텅스텐 도가니의 Hammer mill에 의한 조분쇄 공정을 나타낸 것이다.
1. 서 론
- 그림 2는 본 연구에서 사용한 O-R프로세스 실험에 사용 한 장치의 개략도를 나타낸 것이다. 우선 텅스텐 산화실험 에 사용한 시료는 상용 순 텅스텐 봉(W, ∅8, 3N up)을 5 mm 로 절단하여 사용하였다. 시료를 석영 보트(L 100mm * W 40 mm)에 올려놓고 튜브 전기로에 장입하여 순 산소(O2, 5N up)를 50 ml/min 흘려보내면서 500°C~ 1,000°C에서 소정 의 반응시간 가열하여 실험하였다. 또한 텅스텐 환원실험 은 상용 텅스텐 산화물(WO3, 3N up) 분말을 사용하였으 며, 시료 약 15 g을 석영 보트에 올려놓고 산화실험과 동 일한 튜브 전기로에 장입하여 수소(H2, 5N up)를 50 ml/ min 흘려보내면서 500°C~1,000°C에서 소정의 반응시간 가열하여 실험하였다.
- 이상과 같이, 소정의 온도 및 시간동안 산화 및 환원반응 후 각 시료는 실온까지 냉각하여 전자저울로 무게를 잰 후, SEM(TESCAN -MIRA LMH) 및 XRD(MiniFlex600-Rigaku) 로 분석하였다.
2. 실험방법
- 3.1. 산소(O2)에 의한 고체 순 텅스텐(W)의 산화
- 그림 3은 W-O 2원계 평형상태도[7]를 나타낸 것으로 WO2, W18O49, W24O68, WnO3n-2, WnO3n-1, WO3 등 다수의 텅 스텐 산화물이 존재함을 알 수 있다. 또한 Ihsan Barin 등[6] 이 보고한 데이터 북에 의하면, 대표적인 텅스텐 산화물인 WO2 및 WO3의 생성반응에 따른 이론적 깁스자유에너지는 각각 ΔG1,000K= −407.335 kJ/mol 및 ΔG1,000K= −585.679 kJ/ mol이다. 따라서 1,000 K에서 산화반응이 충분하게 일어날 것으로 추정되며, 다음 반응식 (1), (2)는 산소(O2)에 의한 고 체 순 텅스텐(W)의 산화반응을 나타낸 것이다.
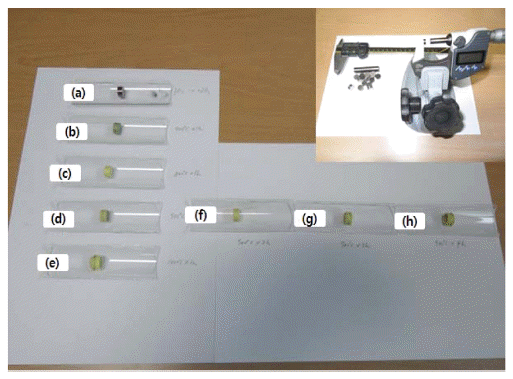
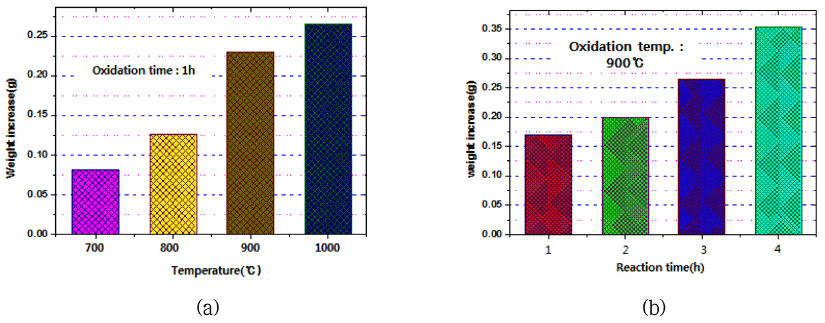
- 그림 4는 산화실험에 사용한 텅스텐 봉 시료 및 석영 보 트의 사진을 나타낸 것이다. 5 mm로 절단한 순 텅스텐 봉 시료를 튜브 전기로에 장입하여 산소를 50 ml/min 흘려가 며 700°C, 800°C, 900°C, 1000°C에서 각각 1시간 동안 산 화반응 후, 냉각하여 전자저울로 시료의 무게를 측정하였 다. 표 1 및 그림 5는 산화반응 전후 무게를 측정한 결과 를 나타낸 것이다. 그림 5(a)에 나타난 것과 같이 반응온 도에 따른 무게 증가 정도를 볼 때 시료의 산화반응이 선 형적으로 증가하며, 특히 900°C 이상의 고온에서 보다 더 빠르게 산화가 진행되는 것이 관찰되었다. 또한 그림 5(b) 에 나타난 것과 같이 900°C에서 반응시간 증가에 따른 무 게 증가 정도를 보면 산화반응은 반응시간에 대해 선형적 으로 진행됨을 알 수 있었다.
- 3.2. 수소(H2)에 의한 텅스텐 산화물(WO3) 분말의 환원
- 우선 텅스텐(W) 산화물은 그림 3 W-O원계 상태도[7]에 서 WO2(s), W18O49(s), W24O68(s), WnO3n-2(s), WnO3n-1(s), WO3(s)을 확인할 수 있으며 이외에도 Ihsan Barin 등[8]의 열역학 데이터 북을 보면 WO(g), WO2(g), WO2.9(s), WO2.96(s), WO3(g), W2O6(g), W3O8(g), W3O9(g), W4O12(g) 등 다양한 텅스텐 산화물이 존재하는 것으로 알려져 있다. 이러한 텅스텐 산화물 중 고상의 WO2과 WO3을 수소로 환원할 경우 Ihsan Barin 등[8]의 열역학 데이터북으로부 터 추산하면 WO2은 식(3)에서 알 수 있듯이 1,400 K 이상 에서 가능하며 WO3은 식(4)와 같이 비교적 낮은 1,100 K 에서도 가능함을 알 수 있다. 이와 같이 수소(H2)에 의한 텅스텐 산화물(WO3) 분말의 환원반응을 위해서는 반응온 도가 매우 중요함을 알 수 있다.
- 그림 6은 수소(H2)에 의한 텅스텐 산화물(WO3)의 환원 반응에 있어서 반응온도 및 시간을 변화시켜 실험한 분말 시료의 사진을 나타낸 것이다. 사용한 산화텅스텐(WO3) 시료는 입도분석(PSA) 결과 D50 = 72.718 μm 정도의 입 자 크기를 나타내었다. 산화텅스텐 분말시료를 튜브 전기 로에 장입하여 50 ml/min의 수소를 흘려가며 400°C~ 1000°C에서 15min, 30min, 1h, 1.5h, 2h, 3h 가열하였다. 우선 그림 6(a)를 보면 반응시간을 1시간으로 고정하고 반 응온도를 400°C~1,000°C로 변화시켰을 때 온도가 상승함 에 따라 노란색(반응 전)→ 청색(400°C)→ 짙은 자주색 (600°C~700°C)→ 회색(800°C 이상)으로 변화하였다. 또한 그림 6(b)를 보면 900°C에서 반응시간을 15min에서 4h까 지 변화시켰을 때 2h 이상 반응시킨 시료는 완전히 회색 으로 변환되었다.
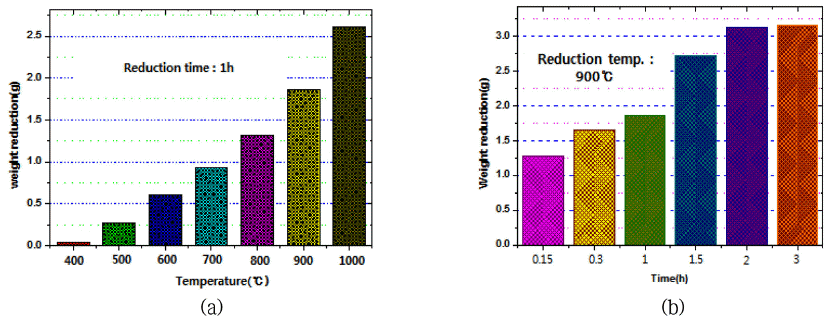
- 표 2 및 그림 7은 수소(H2)에 의한 텅스텐 산화물(WO3) 의 환원반응 시 온도변화에 따른 시료의 중량 변화를 측정 한 결과이다. 그림 7(a)을 보면 환원반응 시간을 1h으로 고 정하고 반응온도를 400°C~1,000o로 변화시켰을 때 반응온 도가 증가함에 따라 분말시료의 중량이 선형적으로 증가 하는 것을 확인하였다. 또한 그림 7(b)를 보면 환원반응 온 도를 900°C로 고정하고 반응시간을 15min, 30min, 1h, 1.5h, 2h, 3h, 4h으로 변화시켜 가열하였을 때 반응시간이 2시간까지는 비교적 선형적으로 중량이 증가하였지만 3시 간 이상 반응한 시료는 중량변화가 거의 없었으므로 환원 반응이 완료된 것으로 보인다. 900°C에서 3시간 동안 환원 반응시킨 시료는 반응 전 15.072 g이었으며 WO3의 이론적 텅스텐(W) 중량비는 79.31%이므로 완전히 환원되었다면 11.954 g이 되어야 하지만 실제 환원반응 후 시료 중량은 11.908 g이었다. 이러한 결과로 보아 이론적 중량비의 99.62%로 환원반응은 대부분 종료된 것으로 추정되었다.
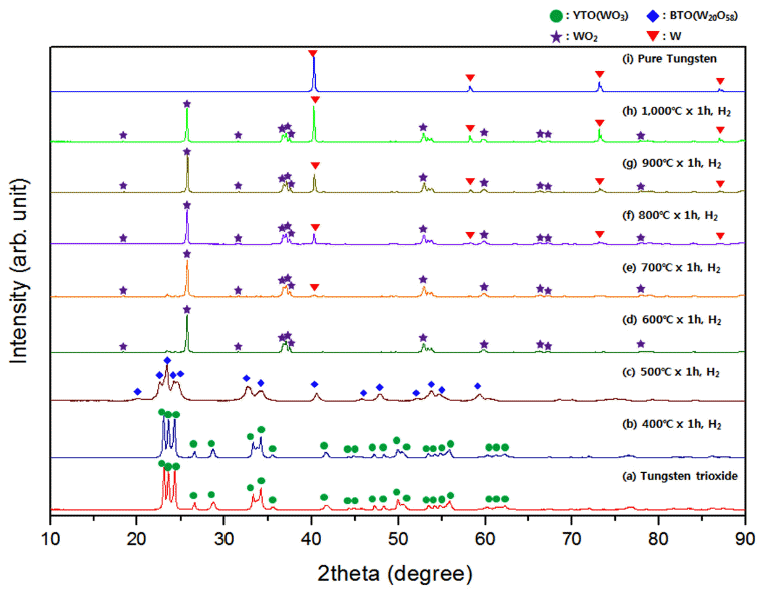
- 그림 8은 그림 7 및 표 2에 나타낸 분말시료에 대하여 XRD를 통해 상변화를 비교 분석한 결과이다. 우선 그림 8(a)는 환원반응 전 텅스텐 산화물 결과이며, 그림 8(b)는 400°C에서 반응한 시료의 결과로서 대부분 YTO(WO3)의 peak만 관찰되었으므로 환원반응이 거의 얼어나지 않은 것으로 보인다. 그림 8(c)는 500°C에서 반응한 시료이며 400°C에서 반응한 시료와는 다른 BTO(W20O58)의 peak가 나타났다. 또한 그림 8(d)는 600°C에서 반응한 시료이며 BTO의 peak는 소멸되고, WO2의 peak만 관찰되었다. 이 WO2 peak의 강도는 온도증가와 함께 약화되지만 1,000°C 에서 반응한 시료(그림 8(f))에서도 잔류하였다. 동시에 700°C부터 순 텅스텐(그림 8(i))의 peak가 관찰되었으며 온도증가와 함께 강도가 증가하였다.
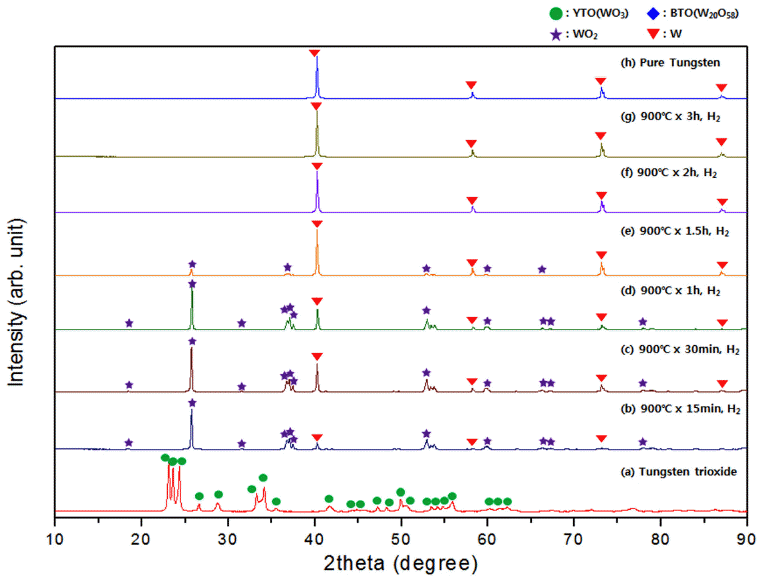
- 그림 9는 그림 8에 나타낸 환원반응 온도를 900°C로 고 정하고 반응시간을 15min에서 3h까지 변화시켜 실험한 XRD로 분석한 결과이다. 이들 시료에서는 그림 8의 실험 결과로부터 예측할 수 있듯이 BTO(W20O58)의 peak는 관 찰되지 않고 WO2의 peak만 관찰되었다. 반응시간이 증가 함에 따라 WO2의 peak 강도가 약화되어 2h 이상 반응한 시료에는 더이상 관찰되지 않고 순 텅스텐 peak만 나타났 으며 이로써 환원반응은 완전하게 종료한 것으로 보인다.
- 그림 10은 그림 9에 나타낸 분말시료 중 일부의 시료를 SEM으로 관찰한 결과이다. 우선 (a), (b), (c)에서 보면 반 응온도 및 시간이 증가함에 따라 텅스텐 결정으로 성장함 을 확인할 수 있으며 1~2 μm정도의 미립자 분말이 다량 관찰되었는데 이는 분말시료들의 XRD 분석결과에서 확 인할 수 있듯이 환원반응이 완전하게 진행되지 않아 WO3 가 미량 잔류하는 것으로 볼 수 있다. 또한 (d), (e), (f)에 서 보면 XRD 분석결과에서 텅스텐 산화물 peak는 완전 소멸된 것과 같이 반응시간이 증가함에 따라 미립분말이 감소하였음을 확인하였다. 텅스텐 결정립은 2 μm~6 μm 정도 크기이며 반응시간 증가에 따라 성장하지 않고 주로 응집(agregation)이 발생하는 것으로 관찰되었다.
3. 결과 및 고찰
Pure tungsten rods used for oxidation experiment on this study; (a) raw tungsten rod, (b)700°C, 1h, (c)800°C, 1h, (d)900°C, 1h, (e)1,000°C, 1h, (f)900°C, 2h, (g)900°C, 3h, (g)900°C, 4h.
Results of increasing weight of samples prepared by oxidation reaction conditions of tungsten rod by oxygen gas.
Comparison of increasing weight of samples prepared by (a) oxidation temperature and (b) reaction time at 900°C on the oxidation experiments of tungsten rod by oxygen gas.
Comparison of the color of each samples prepared by (a) oxidation temperature and (b) reaction time at 900°C on the reduction experiments of tungsten oxide(WO3) by hydrogen gas.

Results of reducing weight of samples prepared by reduction reaction conditions of tungsten oxide(WO3) by the hydrogen gas.
Comparison of reducing weight of samples prepared by (a) oxidation temperature and (b) reaction time at 900°C on the reduction experiments of tungsten oxide(WO3) by the hydrogen gas.
Comparison of XRD patterns of each samples prepared by changing reaction temperature on reduction experiment of tungsten oxide(WO3) by the hydrogen gas.
Comparison of XRD patterns of each samples prepared by changing reaction time on reduction experiment of tungsten oxide(WO3) by the hydrogen gas.
- 본 연구는 산화환원법(Oxidation and Reduction Process) 을 이용하여 순 텅스텐 제품의 사용 후 폐자원(텅스텐 하 드스크랩)의 재활용 시 중요한 산화·환원 반응(oxidation and reduction reaction)에 관한 기초 데이터를 확보하기 위 해 수행되었다. W-O2원계 상태도[7] 및 Ihsan Barin 등[8] 이 보고한 데이터 북으로부터 텅스텐 산화물(WO2 및 WO3) 생성반응에 따른 이론적 깁스자유에너지 등을 추정 하였으며, 이러한 기초 데이터를 참고하여 산화·환원 반 웅에 관한 기초실험을 수행한 결과를 다음과 같다.
산소(O2) 가스에 의한 순 텅스텐 스크랩의 산화실험 에 있어서, 우선 순 텅스텐 봉(rod)의 산화반응 시 생성 가 능한 텅스텐 산화물 중 WO2 및 WO3의 생성반응에 따른 이론적 깁스자유에너지를 각각 ΔG1,000K = −407.335 kJ/mol 및 ΔG1,000K = −585.679 kJ/mol로 계산한 결과, 비교적 낮은 온도 1,000 K에서도 산화반응이 일어날 것으로 추정되었 으며, 실제로 700°C~1,000°C에서 반응시간을 변화시켜 실 험한 결과 온도 및 시간 증가에 따른 산화반응은 비교적 선형적으로 진행됨을 확인하였다.
수소(H2) 가스에 의한 텅스텐 산화물(WO2 및 WO3) 환원반응에 관하여 열역학 데이터북[8]으로부터 추산한 결과, 우선 WO2은 1,300 K에서는 환원반응이 어렵지만 1,400 K 이상에서는 환원반응이 가능한 것으로 나타났다. WO3은 비교적 낮은 온도 1,100 K에서도 환원반응이 일어 나는 것으로 나타났다. 이러한 결과로부터 환원온도 (500°C~1000°C) 및 환원시간(15min~4h)을 변화시켜 실험 한 결과 완전한 환원반응을 위해서는 900°C에서 2h 이상 가열이 필요함을 확인하였다.
4. 결 론
-
Acknowledgements
- 본 논문은 산업통상자원부 에너지기술개발사업의 지원 으로 수행되었으며 이에 감사드립니다(20165020301260).
감사의 글
- 1. H. Yuehui, C. Libao, H. Baiyun and P. K. Liaw: Int. J. Refract. Met. Hard Mater., 21 (2003) 227. .Article
- 2. W. H. Gu, Y. S. Jeong, K. Kim, J. C. Kim, S. H. Son and S. Kim: J. Mater. Process. Technol., 212 (2012) 1250. .Article
- 3. R. U. Ayres: Resources, Conservation and Recycling 21 (1997) 145. .Article
- 4. B. Y. Kang, S. M. Cho, S. G. No and C. B. Song: Annual Meeting Abstract of the Korean Institute of Metals and Materials (2000) 231. .
- 5. Sun, et al. : U.S.A., 8,574,341 (2013) .Article
- 6. Arvidsson : U.S.A., 8,685,137 (2014) .Article
- 7. M. Park and Ohio: Binary Alloy Phase Diagram 2nd Edition, T. B. Massalski (Ed.), ASM. Vol. 3 (1986) 1654. .
- 8. Ihsan Barin: Thermochemical data of pure substances, VCH, New York, (1989) 1654..
Figure & Data
References
Citations

- A Basic Study on the Recycling of Wasted Cemented Carbide by the Zn Bath Process(Ⅰ)
Kyung-Sik Kim, In-Ho Kim, Chan-Gi Lee, Chang-Bin Song
Journal of the Korean Institute of Resources Recycling.2020; 29(6): 35. CrossRef

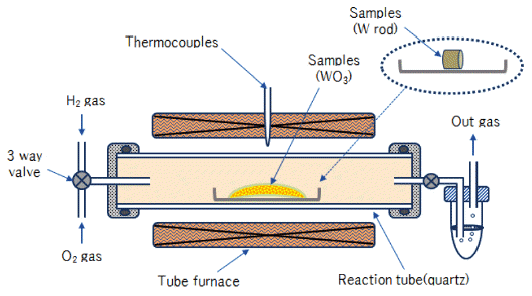
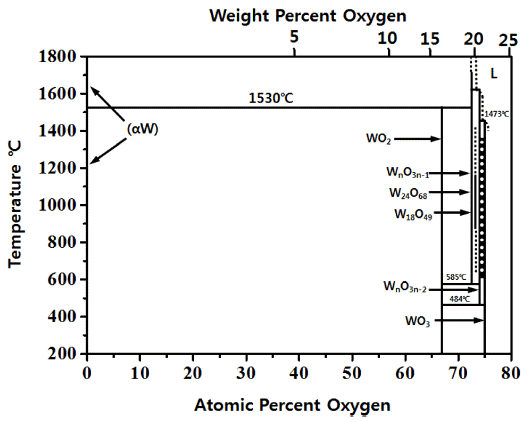


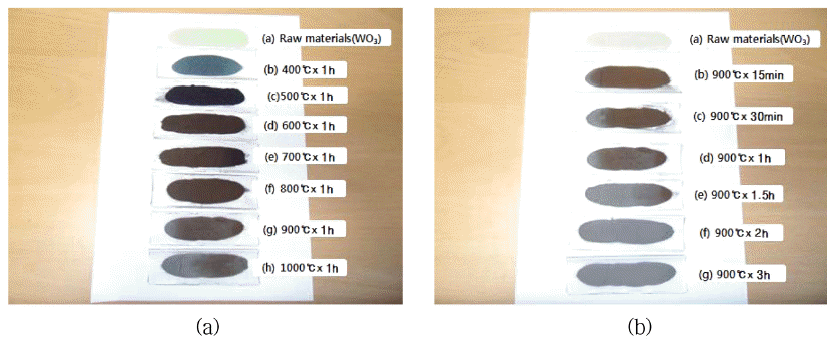


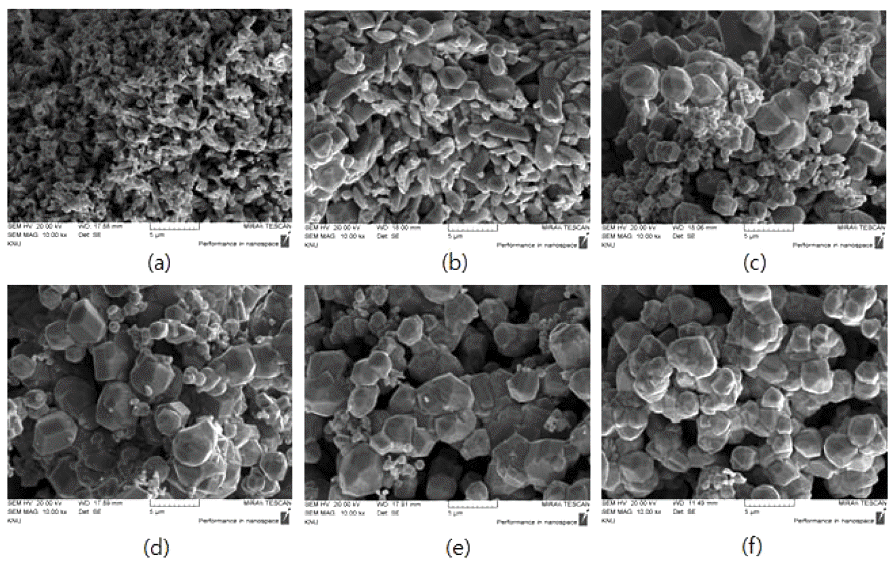
Fig. 1
Fig. 2
Fig. 3
Fig. 4
Fig. 5
Fig. 6
Fig. 7
Fig. 8
Fig. 9
Fig. 10
| 반응 조건 | 석영 보트 중량 (g) | 반응 전 시료중량 (g) | 반응 후 시료중량 (g) | 산화반응에 의한 시료중량의 증가량 (g) |
|---|---|---|---|---|
|
|
||||
| 700℃, 1 h | 17.333 | 9.560 | 9.641 | 0.081 |
| 800℃, 1 h | 16.150 | 9.579 | 9.750 | 0.126 |
| 900℃, 1 h | 17.531 | 9.535 | 9.689 | 0.154 |
| 1,000℃, 1 h | 16.652 | 9.561 | 9.826 | 0.265 |
| 900℃, 2 h | 17.231 | 9.530 | 9.371 | 0.201 |
| 900℃, 3 h | 16.432 | 9.502 | 9.767 | 0.265 |
| 900℃, 4 h | 17.427 | 9.254 | 9.607 | 0.353 |
| 반응 조건 | 석영 보트 중량 (g) | 반응 전 석영 보트 + 시료의 중량 (g) | 반응 후 석영 보트 + 시료의 중량 (g) | 환원반응에 의한 시료중량의 감소량 (g) |
|---|---|---|---|---|
|
|
||||
| 400℃, 1 h | 17.534 | 31.250 | 31.219 | 0.031 |
| 500℃, 1 h | 17.441 | 30.195 | 30.028 | 0.167 |
| 600℃, 1 h | 16.670 | 31.263 | 30.658 | 0.605 |
| 700℃, 1 h | 17.308 | 30.485 | 29.562 | 0.923 |
| 800℃, 1 h | 16.940 | 32.019 | 30.702 | 1.317 |
| 900℃, 1 h | 16.021 | 32.724 | 30.862 | 1.862 |
| 1000℃, 1 h | 17.060 | 33.150 | 30.544 | 2.606 |
| 900℃, 15 min | 18.031 | 33.701 | 32.422 | 1.279 |
| 900℃, 30 min | 16.571 | 31.679 | 30.022 | 1.657 |
| 900℃, 1.5 h | 15.193 | 30.625 | 27.905 | 2.720 |
| 900℃, 2 h | 16.442 | 31.330 | 28.209 | 3.121 |
| 900℃, 3 h | 17.216 | 32.288 | 29.124 | 3.164 |
Table 1
Table 2
TOP
 KPMI
KPMI



 Cite this Article


